Spray cooling processes yield high heat transfer coefficients due to heat absorption associated with latent heat absorption during liquid-vapor phase transition [1-5]. Spray cooling advantages lie in potentially eliminating TIM1 and TIM 2 thermal resistances, yielding significant reduction in overall thermal resistance.
Due to the complexity and chaotic nature of millions of high velocity spray droplets emanating from a nozzle interacting with a heated surface, droplet fragmentation/coalescence, fluid layer formation, imbedded vapor regions and vapor partial pressure effects affect evaporation rate and changes in temperature-dependent thermophysical properties (surface tension, viscosity, conductivity and specific heat, for example). These transient, micron scale droplet-wall interactions produce a statistical time series of locally varying heat transfer coefficients that, when averaged over area and time, yield an average heat transfer coefficient. Given different coolant types, spray injected at different droplet sizes and velocities onto walls of different roughness and spatial orientation, and considering the wide variety of thermophysical properties for different coolant types and wall materials that affect the spray cooling heat transfer coefficient, a large test matrix is required to determine the best combination of parameters to produce the highest average heat transfer coefficient. The many variables involved usually preclude an optimum selection of parameters to achieve this result. To limit use of test methods involving multiple sets of parameter combinations, recourse to CFD methods has advanced as an alternative to select the best combination of parameters producing the highest heat transfer coefficient for a given heat transfer case.
By use of a high speed (6000 frames/s) magnifying digital camera, observation of droplet impact dynamics and evaporation phenomena compared to CFD predictions provide qualitative verification that computer solutions reproduce test-observed micro-phenomena. From test measurements of evaporation times of different size droplets impacting a heated surface and comparison to CFD predictions, quantitative verification of the predictive capability of the commercial CFD software code [6] is confirmed in principle.

Test Results
Table 1 shows digital camera test results determining spray/droplet impact characteristics for an enclosure housing containing an array of nozzles. For a given nozzle, supply pressure determines the range of droplet diameters permitting an average droplet diameter to be used in CFD calculations. Atmospheric pressure is maintained in the test chamber. The corresponding average droplet velocity, flow rate and cooling potential based on complete evaporation of droplets are shown in Table 1. Test data shown are used as input parameters in CFD models.
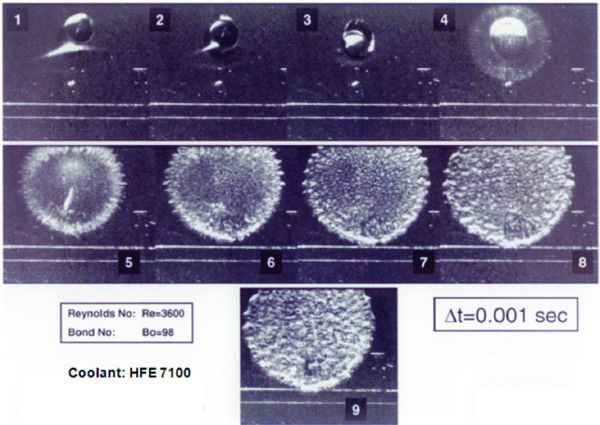
Figure 1 shows the time progression of an HFE 7100 2 mm diameter (D) droplet at V = 72 cm/s vertically impacting a flat plate maintained above the droplet evaporation temperature of 334.5 K. The formation of vapor bubbles continues past 0.001s with total evaporation at ~0.35s. Droplet impact initiates at frame (4), followed by a vapor bubble outer fringe at (5) then interior droplet vapor bubble formation as the droplet flattens out in frames (6) to (9). Past 0.35s, evaporation is complete.
CFD transient results [7] are shown for a HFE 7100 20μm droplet on a heated surface that is maintained above evaporation temperature. These results verify the commercial CFD software code’s [6] capability to provide a qualitative measure of the creation of vapor bubbles once internal droplet evaporation temperature and heat absorption latent heat conditions are attained.
For all test cases, data obtained for average droplet size and velocity are used as input for CFD runs to verify the CFD software code’s capability to generate qualitative agreement with transient droplet impact phenomena and generation of vapor cavities. Since both CFD and test vapor cavities are chaotic in size, growth and location, only qualitative comparisons between test and computer results at a given time under similar conditions are possible. Nevertheless, the presence of similar qualitative features between test and CFD results is a necessary first step to show applicability of CFD methodology to represent features of real spray-surface interactions.
CFD Methodology and Results – Exploration of Micro-details of Droplet-Heated Surface Interaction
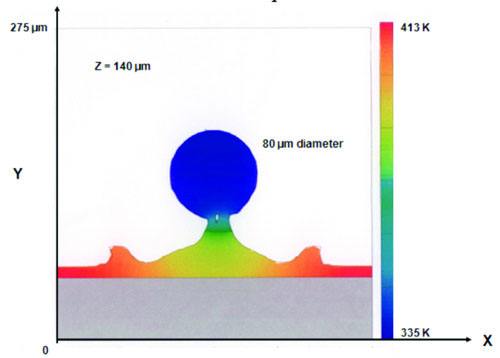
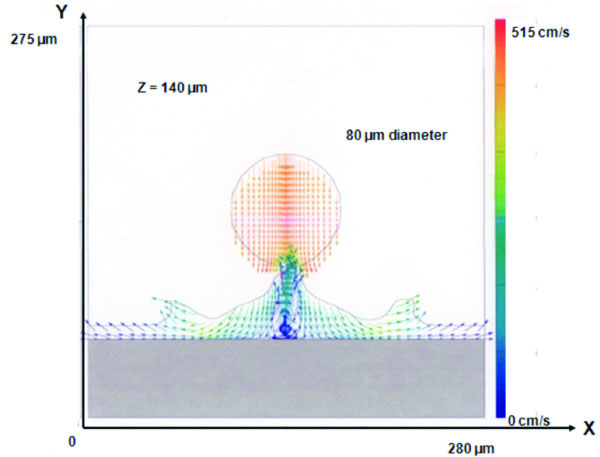
Figures 2 and 3 show a plane-cut, single time snapshot of a cold 335K, 80μm spherical water droplet at 515 cm/s impacting an initial fluid layer 10μm thick whose depth, temperature and free surface geometry have been affected by prior impacted droplets. Wall heat flux is maintained at 60 W/cm2. A sequence of figures at different times during impact provide micro-details of droplet impact dynamics that determine fluid dynamic and heat transfer phenomena over larger areas impacted by numerous droplets. Figure 2 shows a cold water droplet merging with a warmed fluid layer created by prior droplet impacts- here, the wall fluid layer is being heated by conduction with the fluid zone away from the impact point reaching evaporation temperature- but not the latent heat enthalpy value (hfg) necessary for phase change. The arrival of cold droplets and subsequent mixing with the warmed fluid wall layer limits local impact zone fluid temperatures to reach evaporation temperature; thus, showing that heat transfer is generally limited by the formation of fluid surface layers maintained below evaporation temperature. Figure 3 shows details of the velocity distribution during the droplet-fluid wall layer merging process. Note the formation of a heated air void region at the droplet-fluid layer interaction zone caused by prior droplet impacts causing free surface waves to outwardly propagate in the coolant wall layer.
A corresponding figure for the internal wall temperature [7] at the same time as that for Figures 2 and 3 provides data to determine a localized heat transfer coefficient h. Time-sequenced, transient internal wall temperature data averaged over time and contact area as droplet impact and surface wall layer mixing progress then provides the means to determine the heat flux and an average h value. Reference [7] provides results for multiple droplet clouds impacting a localized wall area covered by a fluid surface layer. As impacting, closely spaced droplets have complex, highly nonlinear interaction effects with the wall coolant layer, modeling multiple, closely separated droplets in three dimensions more closely resembles fluid and heat transfer phenomena associated with sprays emanating from a nozzle and can produce a refined estimate of the time and space-averaged heat transfer coefficient. Of practical interest is the use of spray cooling for very high heat flux conditions ~100-300 W/cm2. Reference [7] presents high mass flow cases that constitute an approach to increased cooling through use of a large number of closely-spaced droplets impacting a hot surface undergoing evaporative heat transfer. Results indicate that higher droplet injection velocities together with larger droplet diameters impacting a wall coolant layer can result in impact craters leaving voids in the surface fluid layer. Such cases depend upon droplet size and spray velocity and limit evaporative cooling. Droplet fragmentation can also result from high speed droplet impact with the wall fluid layer which further reduces the heat transfer coefficient as fragmentary fluid bits are not in contact with the wall and not subject to evaporation. Thus, increased spray mass flow does not necessarily yield a higher average heat transfer coefficient.
CFD analysis [7] is used to provide additional insight into the effects of surface roughness, droplet speed, droplet diameter, different coolant types and high/low heat flux conditions for multiple droplet cloud cases insofar as these effects alter h values. For high heat flux cases, surface roughness patterns can provide a means of obtaining high h values beyond those possible for smooth wall surfaces.
Heat Transfer Coefficient Calculation Procedures and Application to Practical Problems
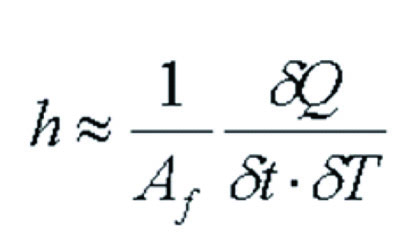
The convection heat transfer coefficient, h, describing heat transfer between the heated surface and coolant droplets impinging on a heated surface with an associated coolant layer is defined below.
Definition of average heat transfer convection coefficient where,
h is average convection coefficient
Af is effective surface sub-area impinged by spray coolant droplets
Q is heat transferred into the coolant
δt is difference in time used for the CFD calculation domain
δT is temperature difference between the average temperature of the heated surface and the saturation temperature of the spray coolant
To determine h for a particular application, first spray characteristics are determined from high speed camera tests (typical of Table 1) or from nozzle manufacturer spray specifications given a supply pressure value corresponding to a given coolant flow rate. These data provide average droplet size and average droplet velocity. Given the nozzle flow rate at a given supply pressure and assuming a uniform spray distribution over the total heat transfer area (A), the number of droplets (n) of given mass (m) and diameter (D) impinging on a sub-area (Af) of A over a given time (δt) can be determined to match area-scaled mass flow considerations. This permits an estimation of (or test-observed) average lateral and vertical droplet spacing. A CFD model of n properly spaced droplets in three-dimensions forming a droplet cloud is modeled with a given velocity that will impact Af. CFD calculations are next run to determine the heat removed from the wall over δt given a prescribed heat flux magnitude within the die. This step involves the dimensional geometry of the die volume (V), wall thermophysical properties and the wall roughness pattern (if present) and the wall orientation with respect to the spray pattern. From the time and space averaged, steady-state CFD solution, the through-wall temperature difference and heat transfer (δQ) extracted from V is available and the h = δQ / Af δt δT definition is applied where δT = Tsurf – Tsat and where Tsurf is the average wall surface temperature over Af from multiple droplet cloud impacts in time δt. Presuming that the local h value over Af extends over all of A as the flow distribution from the nozzle is spatially uniform, then an average h is determined for a specific die geometry and die wall roughness pattern for a specific heat transfer application.
Selection of Conditions for
Optimal Heat Transfer Coefficient
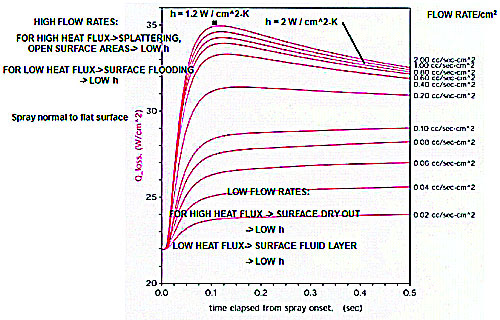
Figure 4 shows the commercial CFD software code’s calculated results for heat loss Q from a given heat transfer volume with an internal heat flux of 30 W/cm2 with surface area A for 20μm HFE 7100 spray droplets. The curves shown are for cumulative droplet flow rates ranging from a low 0.02 to high 2.0 cm3/s per cm2 of surface area and represent the transient heat loss development over time from initiation of spray cooling on the surface of a die material volume initially at room temperature. Of interest is the long-time extent of these curves as steady state operation is approached.
Larger h values constant with time are expected for intermediate flow rates as indicated in Figure 4; at extreme low and high flow rates, h values can fluctuate in time and location due to phenomena described by [7]. While intermediate flow rates apparently lead to optimal h values, smaller droplet sizes are advantageous (~ 20-50μm) as their smaller mass leads to more rapid heating, less tendency to cause splattering and splashing, and short evaporation times.
From Figure 4, curves that peak then decrease for higher flow rate cases indicate that heat loss ultimately decreases with increasing time by the effects previously described once initial heat-up transients pass. For lower flow rates, heat loss decreases due to fluid burnout/loss on the (flat) heated surface and the absence of evaporative cooling replaced by free convective cooling at much lower heat transfer rates. Figure 4 indicates that higher flow rates always produce higher heat loss than lower rates but optimizing heat transfer lies mainly in selection of coolant thermophysical properties, droplet diameter and velocity. The predicted maximum h value shown in Figure 5 is 1 to 2 W/cm2 oC, which is comparable to measured values indicated by Isothermal Systems Research (ISR) through communications in 1998 for the multi-nozzle spray head enclosure referenced in Section 1, Test Results. Results shown are for smooth wall surfaces but different microscale surface roughness patterns show promise to increase h values [7].
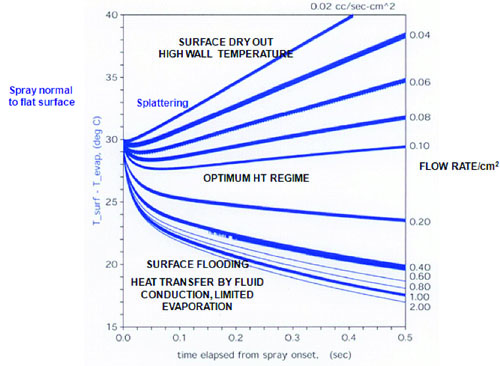
Figure 5 shows plots of Tsurf – Tsat.
For low flow rates (mass of droplets passing through an area A in time δt), wall temperature continually increases while for high flow rates, lower wall temperatures result. Since splattering and coolant layer open void areas can occur at higher spray flow rates as shown in [7], wall temperature increases as the effective evaporative heat removal mechanism is reduced. The fluid dynamic/heat transfer effects at low and high flow rates for low and high heat flux conditions previously described apply so that an intermediate flow rate that prevents unsteady heat transfer conditions from occurring is the best option for sustained high h values. The use of grooved, microscale wall surface roughness to increase heat transfer coefficient has the potential to increase h values as indicated by Reference [7] results; however, such extensions to increase h values remain to be fully explored in future research.
Results from Figures 4 and 5 are specific to parameters selected (heat flux, coolant type, droplet size, droplet velocity and spatial distribution, flow rate, etc.). Further discussion of other parameter variations is provided in Reference [7].
Conclusions
An estimate for heat transfer coefficients, used to develop Figures 4 and 5, is available through a developed program that incorporates parameter variation studies to aid in estimation of average h values. For specific applications, further verification tests must follow after use of CFD results that provide foundation data, to isolate key parameters that have the most influence on obtaining optimal heat transfer coefficients. Correlation equation development only through tests entails a large test matrix involving many variations of key parameters; this procedure is usually economically impractical and time-consuming. By using selected test results for spray characteristics together with recourse to CFD examples that provide data for different size (and material type) coolant droplet clouds at different velocities, this alternative then provides micro-details of droplet-heated wall and droplet-fluid wall layer interaction to serve as a guide to understand the complex fluid dynamic and heat transfer process underlying predicted heat transfer coefficient values. Since high heat flux values are of interest for the next generation of electronic cooling applications, generalizations drawn from results shown in Figures 5 and 6 can prove useful to evaluate effects of different parameter variations on heat transfer and provide guidance for best parameter choices in verification tests to follow.
In summary, for high spray flow rate, high heat flux cases, droplet splattering can occur inducing open wall fluid layer void areas leading to low h values. For low heat flux conditions, surface flooding can occur limiting evaporative cooling resulting in low h values. For low flow rate, high heat flux conditions, wall dry spots result again producing low h values. For low heat flux and low flow rates, surface flooding and thick wall layers develop limiting evaporative cooling. Results are for flat, horizontal heat transfer surfaces with normal spray patterns; surface inclination to limit wall fluid layer buildup should increase the effectiveness of spray cooling substantially. The predicted h values shown in the example cases would have the potential to yield acceptable cooling capability for the majority of the high powered ASIC used for blade server and TELCO router applications. For example, a 77oC maximum, “hot spot” junction temperature would be attained for a lidless ASIC having a 3 cm2 silicon foot print that is dissipating a total power of 128W while having a maximum hot spot power density is equal to 2 times the overall average power density of 42.7 W/cm2 within the silicon if h = 2 W/cm2 oC, and a 30oC spray coolant droplet temperature impinges on the inactive side of the silicon. The example cases presented in this brief summary (as well as other examples) are further detailed in [7]. The methodology and computer methods shown point to a new understanding of spray cooling micro-phenomena and its practical use for electronic cooling applications, and show promise to guide test experimentation to determine optimal heat transfer coefficients for high heat flux applications.
References
[1] B. Horacek, K. Kiger and J. Kim (2005) Single Nozzle Spray Cooling Heat Transfer Mechanisms International, Journal of Heat and Mass Transfer, Vol.8, Issue 8.
[2] Z. Yan, K. Toh, F. Yuan, T. Wong, K. Chao, K. Chan and P. Chua (2010) Heat Transfer Characteristics of Impingement Spray Cooling Systems for Electronic Test Cards. Proceedings of Computer and Automation Engineering 2nd International Conference, Singapore.
[3] J. Kim (2007) Spray Cooling Heat Transfer: The State of the Art International Journal of Heat and Fluid Flow, Vol. 28, Issue 4.
[4] W. Cheng, Q. Liu, R, Zhao and H. Fan (2010) Experimental Investigation of Parameter Effects on Heat Transfer of Spray Cooling. Journal of Heat and Mass Transfer, Vol. 46, No. 8-9.
[5] B. Horacek, J. Kim and K. Kiger, (2004) Spray Cooling of Singular and Multiple Nozzles: Visualization and Wall Heat Transfer Measurements. IEEE Transactions on Device and Materials Reliability, Vol. 4, Issue 4.
[6] Trademark name: FLOW-3D.
[7] C. Ortloff, M. Vogel, (2011) Spray Cooling Heat Transfer – Test and Analysis Results. Proceedings of the 27th Annual IEEE Semiconductor Thermal Measurement and Management Symposium.

