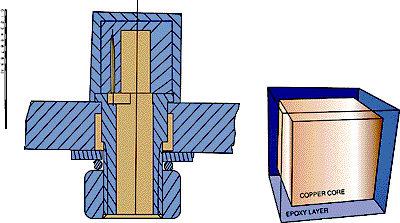
Figure 1: Sketches of the measurement cube.
Introduction
Computational fluid dynamics (CFD) codes are frequently used as design tools to predict the thermal processes in electronic circuitry. CFD codes can easily cope with a high level of complexity (component, board and system levels) which makes them attractive to use. However, the thermal and kinematic complexity of the problems usually encountered in electronic devices makes a reliable prognosis of the heat transfer processes difficult. The thermal boundary conditions encountered at printed circuit boards are typically non-uniform; this is a consequence of the irregular power dissipation. The flow in the interior of electronic cabinets is even more complex. It is usually classified as a low Reynolds number flow on account of the small velocities and the scales of length encountered in the passages. However, the protruding shapes of the electronic components cause flow separation, re-attachment and recirculation which results in regions of transitional and turbulent flows.
The need for heat transfer coefficient data applicable to complex printed circuit board configurations was the reason for a study performed at the Delft University of Technology funded by Philips Electronics. The primary purpose is to derive quantifiable correlations between the local heat transfer coefficient (htc) distributions and the local flow field parameters for idealized configurations of multiple wall-mounted cubes in a channel flow, which are assumed to serve as a diagnostic case for the cooling of realistic electronic circuitry. The validation of CFD codes, and in particular their turbulence models, with the accurate temperature and velocity data is another main objective of the study.
The cubical protrusions, size H = 15mm, were mounted vertically in a wind tunnel section of width D = 50mm and 500mm height. Typical configurations considered were the single cube, the in-line array and the in-line matrix of cubes. The flow field in the different configurations studied was derived from smoke-illumination and oil-film visualizations and the complementary Laser Doppler Anemometry technique (LDA). A modification of the LDA system used permitted us to measure velocity components in all three coordinate directions, and thereby to obtain velocity and Reynolds stress data for the three-dimensional flow field.
This paper is focused on the experimental methods used to evaluate distributions of the local heat transfer coefficient. Typical htc distributions are given to illustrate the possible large spatial gradients which may exist at the surface of the individual cubes. Some flow visualization examples are shown, these are intended to illustrate the complexity of the flows encountered in the study and to provide an interpretation of the heat transfer distributions found. The limitations of space imposed on this article prohibit a thorough discussion of the experimental method, measurement techniques and physics involved. The paper therefore serves mainly as an introduction to the literature published by the authors (see, for example, Meinders et al., 1997a, 1997b and 1998).
Physical Model
The heat transfer measurements were performed with specially constructed measurement cubes. The cubes consist of an internal cubical core of copper covered by a thin epoxy layer with a well-defined thickness of 1.5 mm. A sketch of this element is shown in Fig. 1. The isotropic thermal conductivity of the epoxy substrate was measured using two independent techniques, a steady-state and a transient method, both yielded a value of 0.24 ± 0.01 W/mK. The copper core was equipped with a heat source made from resistance wire. The thermal conductivity of copper is approximately 1000 times greater than that of the epoxy substrate and it, therefore, causes the core to remain uniform in temperature within a tolerance of 0.05 C. The three-dimensional temperature distribution in the epoxy layer was obtained from the numerical solution of the conduction problem in the epoxy substrate with the thermal boundary conditions. The inner thermal boundary condition was the uniform copper temperature, measured with a thermocouple; the outer thermal boundary condition was the surface temperature distribution measured by infrared (IR) and liquid crystal (LC) thermography. The local temperature derivative at the surface in the normal direction yielded the local conductive heat flux through the surface. The local convective heat flux, and thus the heat transfer coefficient, was obtained from the local equilibrium of the heat fluxes at the surface.
The local net radiative heat flux was calculated from the surface temperature distribution, ambient temperatures (channel walls), surface emissivity and view factors. Instead of taking a global descriptor as the reference temperature, as, for example, the inlet or ambient temperature, the local adiabatic reference temperature was used in this study. The adiabatic temperature takes into account the contributions of the upstream heating history to the local mean temperature of the fluid and appeared to be a proper descriptor for the heat transfer problems under consideration (see Moffat and Anderson, 1990).
The experimental uncertainty in the distributions of the heat transfer coefficient was estimated from the thorough analysis given in Meinders et al., 1998, and the standard uncertainty analysis reported in Moffat, 1988. From the study it appeared that the uncertainty in the surface temperature distributions, in the thermal conductivity of the epoxy substrate (0.24 ± 0.01 W/mK) and in the layer thickness (1.5 ± 1 % mm) are the most significant contributions to the total experimental uncertainty in the heat transfer coefficient. An absolute accuracy of 0.5°C in the surface temperature is required to achieve an experimental uncertainty of 10 % in the heat transfer coefficient.
Thermography
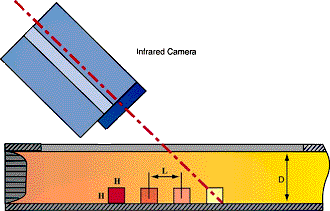
The configurations of cubes were located in a closed wind tunnel, and, therefore, the infrared camera had to be employed at a scan angle of 45° to scan all five faces exposed to the air flow. A sketch of the wind tunnel section with the in-line array of cubes and the infrared camera is shown in Fig. 2.
Figure 2: Schematic of the in-line row of cubes in the channel.
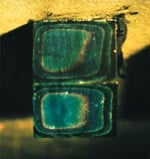
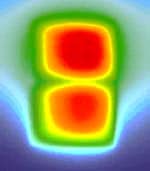
This angled projection reduces the effective spatial resolution and requires a depth of field which must be at least 10 mm. A sufficient spatial resolution in the surface temperature distribution is required in order to measure the local heat transfer phenomena in sufficient detail since there are large temperature gradients at the relatively small cube faces. The required depth of field and a spatial resolution of five pixels/mm were achieved by restoring the measured infrared images with a restoration filter and employing an in-situ calibration (see Meinders et al., 1998). The set up of the camera provides four projections in which the top face is scanned four times, the other sides only once (pairs of the north-top face, the east-top face, the south-top face and the west-top face). The composition of these four projections permits the reconstruction of the total surface temperature. A typical example of the north-top face of the fifth cube in an in-line array of cubes is given in Fig. 3(a).
 |
 |
|
| Figure 3: Infrared image (a) and a liquid crystal image (b) of the north-top projection of the fifth cube in the array (ReH = 5066). | ||
The array was placed in a developing channel flow at a Reynolds number of ReH = UH/v = 5066, where U is the bulk velocity, H is the cube height and v is the kinematic viscosity.
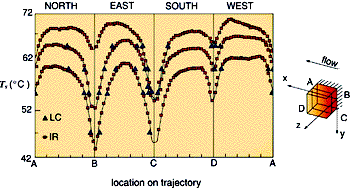
A second technique employed to measure the surface temperature of the cubes was the liquid crystal technique, which is widely used (see, for example, Moffat, 1990). The purpose of this independent measurement was to validate the infrared temperature measurements obtained. A mixture of five thermochromic crystals was considered, for which only the sharp transitions between the red and green appearance were calibrated against a known surface temperature. The main advantage of this method is the objective color interpretation which has an accuracy of 0.5°C. A typical liquid crystal image is shown in Fig. 3(b) for identical experimental conditions as for the IR image shown in Fig. 3(a). The sharp red-green transitions appear as isotherms on the surface. Surface temperature traces along a trajectory parallel to the mounting base at half cube height are given in Fig. 4.
Figure 4: Comparison between infrared surface temperatures (IR, and liquid crystal measurements (LC,
for of ReH = 795, 2086 and 5066, respectively.
A quantitative comparison between the infrared measurements, indicated with , and the LC results, indicated with
, for three different Reynolds numbers, ReH = 795, 2086 and 5066, is shown. The results obtained by the two temperature measurement methods coincide along the total cube surface within the claimed experimental uncertainty of 0.5°C.
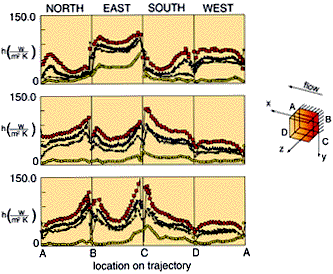
Figure 5: Heat transfer coefficients along a trajectory parallel to the channel wall for the first three cubes (upper figure corresponds to element 1 etc.) in the packed array, parametric in Reynolds number: (o) ReH = 795, (X) ReH = 2086, ReH = 3278 and
ReH = 5066 (from Meinders et al., 1997b).
Selection of Results
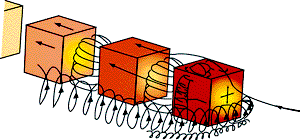
Typical local heat transfer coefficient distributions are given in Fig. 5 for the first three cubes of the in-line array of nine cubes. The htcs along a trajectory parallel to the channel wall at half cube height for Reynolds numbers of ReH = 795, 2086, 3 3278 and 5066 are shown. A cursory examination immediately shows the relatively large spatial gradients in the htcs at the faces of the cube and the marked difference in the htc profiles between the three cubes. This strong variation in the convective heat transfer is explained by the complex vortex structures in the flow field around the cubes. A typical instantaneous smoke visualization of the flow at the symmetry plane around the first three elements is given in Fig. 6 for ReH = 1000.
Figure 6: Smoke visualization of the flow patterns
around the packed array of cubes at the symmetry plane ReH = 1000 (from Meinders et al., 1997b).
The image shows the vortex system upstream of the leading cube and the vortices in the inter-obstacle spacings. A general examination of the flow field around the in-line row of cubes is given in the ‘artists impression’ shown in Fig. 7. The side faces of the leading cube (north and south face in the upper figure of Fig. 5) show a local htc minimum close to the leading edge where the cores of the vortex tubes are located (see Fig. 7). The heat convected from the hot side faces circulates in the vortex tube thus leading to an increase in the local fluid temperature. This temperature rise prevents a beneficial convective cooling. A local maximum in the heat transfer coefficient distribution is observed at the trailing edge of the side faces. This is the location where the relatively cold main flow, separated at the leading side edge, reattaches. Similar heat transfer features at the top face of the first cube are caused by the bound vortex (the bound vortex is shown in Fig. 7). Shear flow is found along the side and top faces of the second and third cube which results in the decay observed in the heat transfer coefficient. The front faces of the second and subsequent cube are characterized by concave htc profiles, which are the result of the flow recirculations in the inter-obstacle spacings (see Fig. 7).
Figure 7: ‘Artists impression’ of the flow field around the in-line row of cubes (from Meinders et al., 1997b)
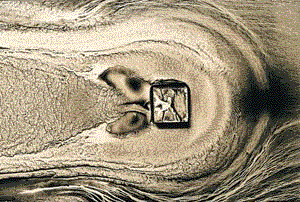
The flow around wall-mounted single cubes is frequently reported in the accessible literature (see, for example, Larousse et al., 1991, Martinuzzi and Tropea, 1993, and Meinders et al., 1997b). Major features of the flow showed that the flow pattern is characterized by a horse shoe vortex, originating upstream of the obstacle and deflected downstream along the lateral sides by the oncoming flow. The near wake recirculation region is characterized by an arc-shaped vortex. A compact vortex was found to exist at the top face, which is bounded by the shear layer separated at the leading edge of the cube. Vortex tubes are found at the lateral faces. These flow features are at least qualitatively similar to those illustrated in Fig. 7 for the leading cube of the in-line row. Figure 8 illustrates the results of two oil-film visualization experiments in reference to the flow around a single cube in a laminar and turbulent developing channel flow.
 |
 |
| Figure 8: Oil-film visualization of a single cube in a developing laminar (a) and turbulent (b) channel flow (ReH = 5000) | |
Although the bulk velocity or mass flow rate was similar in both experiments, the turbulent situation was obtained from boundary layer tripping upstream with a tripping wire (the flow disturbance accelerates the transition to turbulence). Both experiments were performed at a Reynolds number of ReH = 5000. A tracer mixture of jet fuel, low transmission oil and toner was used to make the flow patterns close to the channel wall and cube surface visible. Accumulations and reductions of the pigment identify regions of flow re-attachment, separation and high shear. Although the macroscopic features show similarities, there are some marked differences. The recirculation regions are generally smaller in the turbulent case. The smaller size of the horse shoe vortex affects the slope of the shear layer as it separates at the leading edge. Hence, the cores of the vortices are closer to the leading edge for the turbulent case, which results in flow reattachment on the obstacle walls. For the laminar case, the recirculation envelopes the entire face.
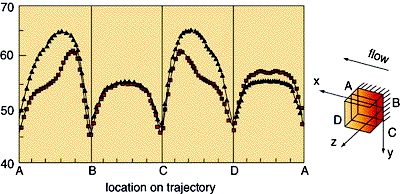
The oncoming flow condition is directly reflected in the convective heat transfer. Infrared surface temperature measurements along a trajectory parallel to the mounting plate are given in Fig. 9. The Reynolds number is ReH = 4440 in both situations. Significant differences in the surface temperature are observed, in particular for the lateral faces which are affected by the flow recirculations. In the laminar case, the vortex envelopes the entire side face which, consequently, leads to high surface temperatures. The increase in heat transfer caused by the turbulent channel flow is reflected in the lower and smaller temperature peaks. This single cube experiment illustrates the significance of the oncoming flow conditions when crucial components on a realistic printed circuit board in an electronic cabinet are considered.
Figure 9: Comparison of surface temperature measurements for the heated single cube in a developing turbulentand laminar
channel flow. The temperatures are shown along the trajectory ABCD as indicated in the sketch (ReH = 4440).
Conclusions
This paper has presented the experimental methods used to determine local convective heat transfer distributions from configurations of wall-mounted cubes in a channel flow. It has been shown that high accuracy in the surface temperature distributions is obtained by image restoration and in situ calibration of the infrared measurements. From the flow analysis it appeared that the flow structure around the protruding cubes is characterized by flow separation, re-attachment and recirculation which dictate the local convective heat transfer phenomena significantly. For example, the leading cube in the in-line row showed steep gradients in the convective heat transfer, which was attributed to the different flow regimes distinguishable in the proximity of the cube (vortices, flow re-attachment, etc.). The experiments for the single wall-mounted cube in a laminar and turbulent channel flow showed the significant influence of the oncoming conditions on the local flow structure and, thus, on the distributions of the local heat transfer coefficient.
Finally, it has been demonstrated that the scientist has a very challenging task if the objective of the experimental analysis is to acquire accurate data of the distributions of the local heat transfer coefficient for idealized configurations of wall-mounted cubes. These distributions enhance insight into the thermal processes encountered in electronic equipment and provide the thermal engineer with fundamental background data for optimal printed circuit board design.
References
| 1. | Meinders, E.R., Meer, T.H. van der, Hanjalic, K. and Lasance, C.J.M. (1997a) Application of Infrared Thermography to The Evaluation of Local Convective Heat Transfer on Arrays of Cubical Protrusions, Int. Journal of Heat and Fluid Flow, Vol 18 No 1, pp. 152-159. |
| 2. | Meinders, E.R., Meer, T.H. van der, Hanjalic, K. (1998) Local convective heat transfer from an array of wall-mounted cubes, Int. J. of Heat and Mass Transfer, Vol 41 No 2, pp. 335-346. |
| 3. | Meinders, E.R., Martinuzzi, R.J. and Hanjalic, K. (1997b) Interaction between The Flow Field and the Local Convective Heat Transfer of a Single Wall-Mounted Cube in a Turbulent Channel Flow, submitted for publication consideration. |
| 4. | Moffat, R.J. and Anderson, A.M. (1990) Applying Heat Transfer Coefficient Data to Electronics Cooling, Journal of Heat Transfer, Vol. 112), pp. 882-890. |
| 5. | Moffat, R.J. (1988) Describing the Uncertainties in Experimental Results, Experimental Thermal and Fluid Science Vol. 1 no. 1, pp. 3-17. |
| 6. | Moffat, R.J. (1990) Experimental Heat Transfer, Proceedings, 9th International Heat Transfer Conference, Jerusalem, Israel, Vol 1, pp. 187-205. |
| 7. | Larousse, A., Martinuzzi, R. and Tropea, C. (1991) Flow around Surface-Mounted, Three-Dimensional Obstacles, 8th Symposium on Turbulent Shear Flows, TU-Munich/German, 1, pp. 14-4-1/14-4-6. |
| 8. | Martinuzzi, R. and Tropea, C. (1993) Flow around Surface-Mounted, Prismatic Obstacles Placed in a Fully Developed Channel Flow, J. Fluids Engineering, Vol. 115, pp. 85-92. |

