Introduction
Increased performance in electronic systems along with higher packaging densities have made temperature a critical parameter. Measurements of temperature, velocity and heat transfer in electronic systems are challenging due to complex materials, configurations, and non-isothermal flows.
Earlier articles have considered different aspects of thermal measurements. Appropriate references include: [Azar; Lasance; Lee; Moffat]. Relying on information extracted from Keltner, 1997, this article will explore thermal measurement errors.
Temperature has been measured, why bother with heat flux?
A common assumption in temperature measurements, especially those using thermocouples, is that sensor and process temperatures are the same. However, this assumption is generally false!
Temperature and heat flux measurements in the thermal world correspond to voltage and current measurements in the electrical world. As with voltage and current, temperature and heat flux are closely related. If both are measured, the relationships between them can be used to describe the system. If only one is known, system performance is difficult to characterize. Accurate temperature measurements depend on understanding the heat transfer in and around the sensor. Similarly, accurate heat flux measurements often depend on accurate temperature measurements.
Measuring temperature with thermocouples
Thermocouples (TCs) are a common temperature sensor [ASTM; Moffat]. What happens when one is used to measure surface temperature?
| When a TC is touched or attached to a surface, heat flows from the object into the TC, and the heat flow depresses the local temperature. The time dependent depression is influenced by the properties of both the object and the TC, the orientation and design of the TC, and heat loss from the TC leads. The TC reading depends on a thermal balance affected by all of these factors. |
An effective method for analyzing measurements involves visualizing the process as a balance, (Figure 1). The left-hand balance pan contains a number of physical contact parameters. For surface temperature measurements, some pertinent parameters include the following: thermal conductivity of the surface and the thermocouple, orientation of the thermocouple relative to the surface, air flow velocity, thermocouple diameter and junction thickness, and any material used to reduce the thermal contact resistance between the thermocouple and the surface. The right-hand pan shows the outcome – the measured temperature. The balance is used to identify those factors that cause the measured temperature to differ from the surface temperature. It also helps the visualization of best and worst cases:
Worst case (highest errors):
| TC perpendicular to surface – minimum contact area and higher thermal contact resistance Air flow over the lead wires – increases the ‘fin effect’ heat loss |
Best case (lowest errors):
| TC parallel to surface for approximately 20 wire diameters – increases the contact area and isolates the hot junction from the fin effect heat loss (most commercially available sensors use this design principle) |
The errors described above are ‘coupling or installation errors.’ Using perfectly calibrated thermocouples and data acquisition systems will not eliminate these measurement errors. Calibration enables precise measurements of the sensor temperature. Determining the accuracy of the process temperature measurements requires an analysis of the coupling errors, which are specific to the application.
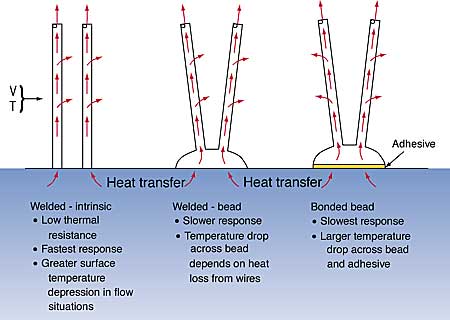
Figure 2: Thermocouple designs
Transient response models were developed for the contact temperature measurements shown in Figure 2, on thermally thick [Keltner and Beck] or thin walls [Sobolik, et al]. The thick wall analysis is generally accurate when the wall thickness is at least ten times the wire diameter. Steady state measurement errors are estimated by evaluating these models at large times. For measurements with contact resistance and leadwire heat loss, the thermocouple temperature is approximated by [Keltner and Beck]:
where TTC = measured temperature, Tsurface = surface temperature, x = effective measurement location (bead thickness/wire radius), Bi-lateral surface Biot Modulus (heat transfer coefficient * wire radius/wire thermal conductivity), B = contact surface Biot Modulus (contact heat transfer coefficient * wire radius/surface thermal conductivity), and K = thermal conductivity ratio wire/surface).
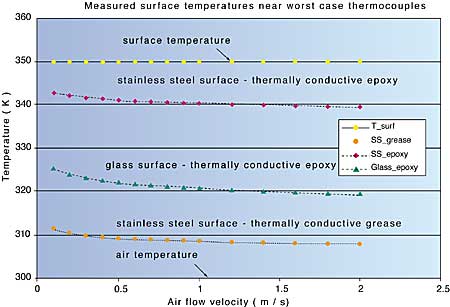
A ‘near worst case measurement’ is a bare 0.25 mm OD, type E thermocouple installed normal to a stainless steel or glass surface at 350 K, with: a) a bead thickness equal to the wire diameter, b) a 0.025 mm layer of thermally conductive grease (k = 0.068 W/m K) or epoxy (k = 1.8 W/m K) at the surface/thermocouple interface, and c) lateral surface heat loss from the thermocouple wires due to radiation and convection for airflow at 300K and 0.1 to 2 m/s. The linearized radiation heat transfer coefficient, hrad, is approximately 1.5 W/m2 K and the convective coefficient, hconv, ranges from 100 to 300 W/m2 K. For Equation 1: K = 1W/mK (stainless) and 22W/mK (glass); Bi = 0.0013 for 1m/s velocity; B = 0.4 for epoxy on the stainless and 8.7 for the glass.
Figure 3 depicts the measurement errors for this extreme example. For the stainless steel surface (thermal properties similar to the thermocouple wires), the errors at 1 m/s are 41 K or 82% using the grease and 10K or 20% using the higher conductivity epoxy. The errors increase significantly for the glass, which has a lower conductivity more representative of electronic components. Using the epoxy bond, the measurement error is approximately 29K or 58%! These calculations of measurement errors demonstrate the importance of examining the balance.
Figure 3: Estimated surface temperature measurement errors
Equation 1 shows that heat loss from the thermocouple wires will always cause some error. Comparing the curves for the epoxy bonds shows the effect of the surface thermal conductivity. The two curves for stainless steel show the effect of contact resistance. As noted earlier, these coupling errors are not affected by either thermocouple or data system calibration even though the errors range as high as 82%.
Measuring heat flux
The same process can and should be used to evaluate heat flux measurements. Temperature gradient sensors are commonly used in electronics cooling studies [Keltner].
For temperature gradient sensors, the steady state heat flux is obtained from a thermal version of Ohms Law, which relates heat flux (thermal current) to temperature difference (thermal potential) across a known thermal resistance:
| q = k |
(2) |
where q – heat flux (W/m2), k – resistance layer thermal conductivity (W/m K), T = temperature difference (K) and
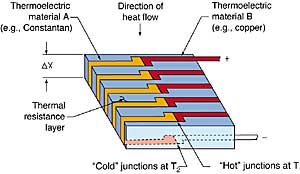
X = resistance layer thickness. Since temperature difference is typically small, either thermopiles [Ortolano and Hines] or a pair of resistance thermometers [Doorley and Oldfield] are used to enhance sensitivity. A schematic of a thermopile HFT is shown in Figure 4.
Figure 4: Thermopile type of heat flux transducer
Designing heat flux measurement applications
Azar and Moffat conducted an experiment in a wind tunnel to obtain heat transfer coefficients. Twelve heated aluminum blocks were arranged in a three column by four row format on a circuit board. On each block, measurements were made of temperature, power dissipation, and heat flux with thermopile type sensors on the top surface. The italicized topics highlight important issues that should be addressed when designing such experimental applications.
Estimating temperature and heat flux. Select a sensor with adequate sensitivity and range.
According to a correlation devised by Eckert and Drake, the local heat transfer coefficient on the 25 mm square blocks is:
| (3) |
where the dimensionless variables are Nu = the Nusselt Number, Re = the Reynolds Number, and Pr = the Prandtl Number.
With a wind tunnel inlet velocity of 1.5 m/s and air temperature of 40°C, the Reynolds Number (Rex) at the center of the plate is approximately 1100. The Prandtl Number (Pr) of air is approximately 0.7, giving a local Nusselt Number (Nux) of 9.8. The estimated local heat transfer coefficient is: 21 W/m2K. Turbulence inside the enclosure might increase this value by 50% or more.
Using the following equation:
| Q / A = h |
(4) |
the estimated block temperature is 113K: where Q = power dissipation (3 W per block), h = heat transfer coefficient, and A = surface area (top plus edges) = 0.00126m2. The average power dissipation is 0.24 W/cm2. This estimate assumes all power is dissipated out of the top and edges. Azar and Moffat indicated lower values due to heat transfer into the circuit board.
A thermopile sensor has been found with a sensitivity of 634µV/(W/cm2). The flux* sensitivity product indicates a 15µV output. For a data system with a 12 bit analog to digital converter and a 1 mV range; least significant bit resolution is 0.00038 W/cm2 or 0.16 %.
Transient response characteristics. Ensure capture of transients of interest and prevent aliasing.This example concerns steady state heat transfer. However, turbulence and vortices generated inside the enclosure can cause fluctuating readings.
Sensor and installation effects. Do they significantly affect the heat transfer process?
Mechanical considerations involve potential sensor effects on the flow field. If the sensor thickness exceeds the boundary layer thickness, the boundary layer may mechanically trip, and increase the heat transfer coefficient. Other effects are thermal. Temperature discontinuities may cause thermal tripping. Sensor characteristics may alter the thermal balance and the uncertainty.
The sensor thickness is 0.3 mm; the estimated boundary layer thickness is 1.9 mm [Keltner]. It should not mechanically trip the boundary layer.
The sensor conduction resistance is 21 K(W/cm2). Rearranging Equation 2, the estimated temperature drop across the sensor is 5K. The aluminum blocks are essentially isothermal (this would not be true for low conductivity materials); therefore, the sensor surface temperature will be lower than the block surface temperature. If this temperature difference occurs as a step discontinuity at the edge of the sensor, it would probably initiate the development of a new thermal boundary layer (i.e., trip it) [Eckert and Drake].
How do the conduction resistance and different optical properties of the sensor affect heat transfer? The added HFT thermal resistance may cause thermal shunting, which is effectively the reverse of spreading resistances analyzed by Lee.
Trenthowen evaluated measurement errors for surface mounted heat flux transducers (HFT). The measurement error is defined as:
| E = 1 – (qHFT / qundisturbed) | (5) |
where qHFT = heat flux through the transducer and qundisturbed = that without the transducer. The effective thermal resistance at the measurement location is:
| Reff = RHFT + Rcontact + (Rhsurf– Rusurf) | (6) |
where the subscripts are: eff = effective thermal resistance, HFT = transducer thermal resistance, contact = resistance of any bond material, hsurf = surface thermal resistance over the HFT, and usurf = undisturbed surface thermal resistance.
The measurement error is bounded by:
| Emin = Reff / (Reff + Rsite) | |
| (7) | |
| Emax = Reff /( Reff + Rundisturbed) |
where Rsite = total thermal resistance at the HFT location and Rundisturbed = total component thermal resistance. The aluminum blocks have a very low thermal resistance. As a result:
| Reff = RHFT + Rcontact + (Rhsurf– Rusurf) | (8) |
Assuming the bond material is the conductive epoxy described earlier, the contact resistance is 0.13 K(W/cm2). Rsite and Rundisturbed differ because the Kapton HFT has a radiative emissivity of approximately 0.5; unpolished aluminum has a value of approximately 0.12 [Keltner]. The measured total heat transfer coefficient was approximately 0.0023 W/cm2K; the linearized radiation heat transfer coefficient was estimated to be 0.0003 W/cm2K [Keltner]. The convective heat transfer coefficient is the total minus the radiative coefficient. Using Rsite= (total heat transfer coefficient)-1=435 K(W/cm2) and Rundisturbed=500, then Equation 6 gives Reff= -43.5 and the error bounds are:
| Emin = -0.111 and Emax = -0.095 | (9) |
The negative sign indicates the measured heat flux is 9.5 to 11% higher than the undisturbed value. Kapton’s higher emissivity increases heat transfer more than the conductive resistance reduces it.
The temperature and heat flux discontinuities can be prevented by covering the entire top surface with a Kapton film, the same thickness as the HFT. The different thermal and optical properties of Kapton will change the temperature and the total heat transfer. However, the results may be more consistent. By analyzing the balance, one will account for the changes.
Temperature effects. Account for temperature related sensitivity changes.
The estimated temperature rise of 113 K could affect the sensitivity of the thermopile. The thermal conductivity of Kapton increases by 5% for a 50K temperature rise. The T across the sensor and the output are inversely proportional to the thermal conductivity (Equation 2). Standard tables show the sensitivity (or Seebeck coefficient) of Type K thermocouples used in the HFT does not change significantly from 41µV/K over the range from 25 to 75°C. (Some HFT designs use one to offset the other and reduce sensitivity changes.)
Reference temperature effects. Different choices affect the answers.
Azar and Moffat calculated heat transfer coefficients using three reference temperatures: the inlet air temperature; a local temperature estimated from upstream power dissipation; and, an individual power-off component temperature. For the first two methods, the mean value of the heat transfer coefficient in one row was 15.6 W/m2K with a variation of 24%. For the power-off method, the value was 22.5 W/m2K 5%. This demonstrates how experiment design affects both the levels and the uncertainties.
These calculations illustrate the requirements for designing an experiment or estimating measurement errors and uncertainties. Checking on alternate measurement approaches is a final step.
Summary
Thermal measurements must be designed to suit the application in order to provide accurate results. Two examples demonstrate important points:
1) accurate temperature measurements require proper accounting for all heat transfer: and,
2) when measuring temperature or heat flux, there is no silver bullet or universal solution.
References:
| 1. | ASTM, Manual on the Use of Thermocouples in Temperature Measurement, ASTM-MNL 12, ASTM, Philadelphia, 1993. |
| 2. | Azar, K., Measuring Fluid Velocity in Electronics Enclosures, Electronics Cooling, January, 1998. |
| 3. | Azar, K., and R. J. Moffat, Heat Transfer Coefficient and Its Estimation in Electronic Enclosures, Proceedings of the National Electronic Packaging and Production Conference, Boston, 1991, pp. 361-372. |
| 4. | Doorley, J.E. and M. L. G. Oldfield, The Theory of Advanced Multi-Layer Thin Film Heat Transfer Gauges, International Journal of Heat and Mass Transfer, 30(6), pp. 1159-1168, 1987. |
| 5. | Eckert, E.R.G. and R.M. Drake Jr., Analysis of Heat Transfer, McGraw-Hill, New York, 1972. |
| 6. | Keltner, N. R., Heat Flux Measurements: Theory and Applications, Chapter 8 in Thermal Measurements in Electronics Cooling, Edited by K. Azar, CRC Press, 1997. |
| 7. | Keltner, N. R. and J.V. Beck, Surface Temperature Measurement Errors, Journal of Heat Transfer, Vol. 105, pp. 312-318, May, 1983. |
| 8. | Lasance, C., Thermal Resistance: An Oxymoron? Electronics Cooling, May, 1997. |
| 9. | Lee, S. Calculating Spreading Resistance in Heat Sinks, Electronics Cooling, January, 1998. |
| 10. | Moffat, R. J., Notes on Using Thermocouples, Electronics Cooling, January, 1997. |
| 11. | Ortolano, D. J. and F. F. Hines, A Simplified Approach to Heat Flow Measurement, Advances in Instrumentation, Vol. 38 – Part 2, ISA, 1983. |
| 12. | Shaukatullah, H., et al, “Design and Optimization of Pin Fin Heat Sinks for Low Velocity Applications,” 12th IEEE SEMI-THERM Symposium, Austin, TX, 1996. |
| 13. | Sobolik, K. B., N. R. Keltner, and J. V. Beck, Measurement Errors for Thermocouples Attached to Thin Plates: Application to Heat Flux Measurement Devices, ASME-HTD-Vol. 112, Heat Transfer Measurements, Analysis, and Flow Visualization, Editor – R. K. Shah, 1989. |
| 14. | Trenthowen, H.A., Systematic Errors with Surface Mounted Heat Flux Transducers and How to Live with Them, In-Situ Heat Flux Measurements in Buildings – Applications and Interpretation of Results, U.S. Army Cold Regions Research and Engineering Laboratory, Hanover, NH, CRREL Special Report 91-3, 1991, pp. 15-27. |


