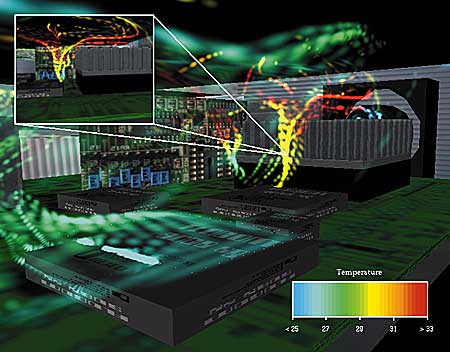
Within the realm of CFD-based flow analysis, the presentation of data is a vital issue. Researchers and developers need to gain insight, and non-technical managers and commercial staff have a critical need to understand the true ramifications of the data. Unfortunately, current methods for visualizing flow have limitations that make it difficult to interpret vast quantities of data.
New flow visualization techniques, however, can help overcome these limitations and greatly facilitate the interpretation of data for the benefit of technical and non-technical personnel alike. This article explains some of the major limitations of current flow visualization techniques, and introduces the reader to some of the most promising new techniques, including the use of flow probes, texture, stream-surfaces, surface particles, and others which are still undergoing research.
Background: The Challenge of Understanding Flow
Flow plays a major role in electronics cooling problems, and understanding its complexities can help in the thermal management of ICs. One way to understand flow is to perform experiments [1]. However, experimentation may not be possible if test facilities are not readily available, if the product has not yet been built, or if there is a need to evaluate many different possibilities. In such cases, the use of Computational Fluid Dynamics (CFD) may prove extremely useful as an alternative or adjunct to experimentation to gain an understanding of flow.
Modern CFD packages can easily generate detailed information for different versions of a new product. And the power of today’s desktop computers has enabled the development of efficient methods to solve the equations. But beyond the issue of simply generating data is the question of how to gain insight about what all the data really means.
One possibility is to compress the spatial information into a set of key numbers: critical temperatures, averages, and so on. We can easily learn by simulation that a certain part becomes too hot. Then, based on our skill and experience, we can change the design�sometimes to find out in a subsequent simulation that the problem has actually become worse due to some subtle, overlooked effect. Insight regarding the final result�the distribution of temperatures�does not suffice. Rather, it is essential, as we seek to optimize our design, to have insight about the processes that led to these results.
Let us consider one of these important processes: convection, the transport of heat via flow. As noted earlier, flow structures can be very complex. Turbulence leads to convoluted, swirling motions. “Manhattan”-like structures inside typical electronic products force a simple flow from the inlet to split into many smaller streams. Heat dissipating components cooled by the flow also produce convective flows themselves.
Three-dimensional simulation can help us better comprehend cooling in today’s electronic products, but at the same time it leads to even more data, adding to the complexity of understanding flow. This necessitates the use of powerful interpretive methods. One of these, flow visualization exploits the unmatched capabilities of the human visual system to detect and understand structure from spatial data.
Current Flow Visualization Methods and Their Limitations
Suppose we have a 3D flow-field. To depict this, we must reduce and simplify a huge amount of data. One option is to reduce the vector data to scalar quantities, such as the magnitude of the velocity. We can then visualize these easily via iso-surfaces. However, the resulting images can be misleading because the directional information is lost.
The second approach involves spatial selections. We make a cross-section, and depict the velocities as arrows. Again, this approach is problematic because the velocity component perpendicular to the cross-section is lost. Also, multiple cross-sections are needed to view the overall flow. Reconstructing the overall flow pattern from these is a complex mental task. An alternative is to draw 3D arrows distributed regularly over space. However, if the sampling density is too high, a heavily cluttered image results; if it is too low, spatial structures become indiscernible. And, in both cases, the use of real-time rotation or stereo-images is necessary to give a cue of the 3D direction.
Another important class of methods involves putting something in the flow and observing what happens. Streamlines�the trace of particles inserted into the flow�are the usual example. These often give more insight regarding the structure of the flow. However, selecting start-points requires extreme care; information on the magnitude of the velocity is lost; and, again, 3D perception is difficult. A better alternative uses stream-surfaces. Here, rather than starting with a point, we start with a line (a virtual rake), which sweeps out a surface. The shading of the surface provides a better cue on the 3D structure of the flow. Another alternative is to insert particles and, using animations, to view their convection by the flow. This gives good insight into the magnitude of the velocity, but the spatial position of the particles is often hard to judge.
Regardless of the method used, there is a risk that important features may be overlooked if too few items are used, and that a mess will result if too many items are used. In view of the limitations of current techniques, let us now consider some new methods.
New Flow Visualization Methods
Flow Probe
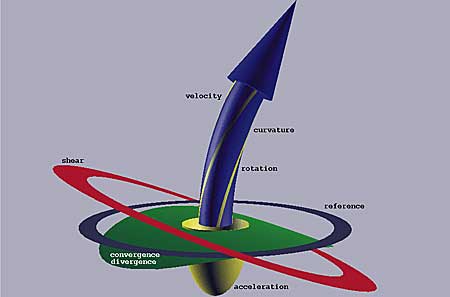
The flow probe [2] was developed to provide detailed information on a small area of the flow. An arrow only shows the velocity, the flow probe also shows the local change of velocity. In other words, it depicts a tensor instead of a vector. The tensor is split into components that are visualized separately.
In Figure 1, the bent arrow shows the direction and curvature of the streamline; the candy-stripes show rotation; the ellipsoid shows acceleration or deceleration; the green membrane shows convergence or divergence; the red ring shows shear; and the gray ring serves as a reference for the different elements. With an interactive system, the user can move this probe manually or with the flow and leave copies behind.
Figure 1. Probe for inspecting local flow pattern.
Texture
Texture is an important visual perception cue, which can be exploited to visualize flow. In contrast to streamlines, it provides a more natural and essentially continuous image of flow patterns. Especially when shown animated, texture enables the viewer to grasp the dominant flow patterns immediately.
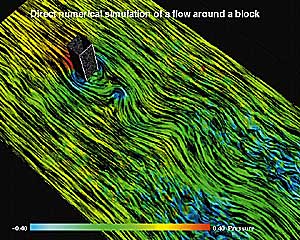
Textures can be generated via two different techniques. With Line Integral Convolution (LIC) [3] the start point is a pure noise texture. For each pixel, a short streamline is calculated, and the noise below this streamline is averaged. Spot Noise [4] is based on the splattering of small patterns with a random position and intensity on the image plane. If we use ellipses aligned with the flow, the resultant texture depicts the flow patterns. Figure 2 shows a result from a direct 3D turbulence simulation of the flow around a block [5].
Figure 2. Texture shows turbulent flow around a block.
(Courtesy: Computational Mechanics and Numerical
Mathematics Group, University of Groningen)
Stream Surfaces
Stream surfaces can be constructed in several ways. One approach is to trace a set of points on a line and to generate a mesh from these. However, this can easily lead to degenerate meshes, especially when the flow curls around complex geometries.
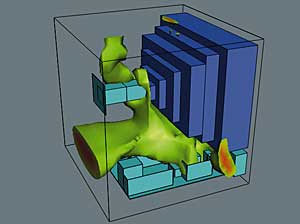
A different approach involves using CFD-methods [2]. If we prescribe the concentration of ink at the boundaries and perform a pure convection simulation, the resulting iso-concentration surfaces are stream surfaces. This method generated the flow pattern shown in Figure 3: The flow driven by natural convection in a television set. The concentration of ink at the inlets was made proportional to the local velocity, so the dominant flow pattern automatically emerged.
Figure 3. Stream surface in a TV set.
(Courtesy: CJM. Lasance, Philips Research)
Surface Particles
Particles provide an excellent cue of velocities; stream surfaces show structure. The idea behind surface particles [6] is to combine these advantages. A surface particle is a small facet that is convected by the flow. A standard particle can be modeled as a point, but a surface particle also has an associated normal vector. During the convection both position and orientation are updated.
If we use a line as the source for the particles and release many (say 5,000 or more) particles, the result is a moving textured stream surface that shows the flow very clearly. By varying the properties of the source we can emulate different flow visualization methods. A point gives a stream ribbon; a circle gives a tube. If we release the particle via pulses instead of continuously, clones of the source (a sphere, cube or line) are generated, and they are convected and deformed by the flow.
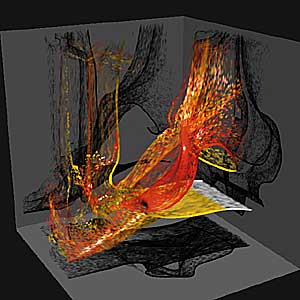
Figure 4 shows the same flow pattern as Figure 3. The recirculation pattern is clearly visible. Shading and cast shadows contribute to an improved perception of the 3D structure. Figure 5 shows the flow within a PC. It illustrates how, in a relatively simple case, complex phenomena, such as the re-entrainment of hot air into the heatsink, occur within the airflows. The image is a still from an animation generated with Flomotion, a new post-processing module developed by Flomerics Group Plc for use with FLOTHERM CFD software. Thanks to a tight integration with the CFD software and an intuitive user interface, such animations can easily be defined.
Figure 4. Surface particles in a TV set. (Courtesy: C.J.M. Lasance, Philips Research.)
Figure 5. Surface particles in a PC case. Courtesy: Flomerics Group Plc.)
Future work
Although much progress has been made in the past ten years, flow visualization still remains a challenge. Most of the current methods, including the sample described here, rely on the user to interrogate the data. This can be a time-consuming process with always a chance that important aspects may be overlooked.
An important branch of research in this area is automated analysis. Several methods have been developed to detect particular features in the data, which can serve as a summary of the flow field. A good example is the detection of vortices [7]. Especially for dynamic data sets, this approach saves much time and disk-space. Another example is topological flow analysis [8]. Here the structure of the flow field is analyzed, leading to a subdivision of the field into separate areas. However, these approaches are not the final answer yet.
In the ideal case, all interesting or peculiar aspects of the flow are automatically extracted and presented to the user of CFD-packages, so that it immediately becomes clear what the problem is of a certain design and how it can be solved. The hard part is arriving at the proper definition of “interesting” and “peculiar”. It is especially in this area that co-operation between visualization researchers and end-users of CFD should be stimulated and encouraged.
References:
1. Azar, K., and Russell, E.T., Effect of Component Layout and Geometry on Flow Distribution in Electronic Circuit Packs. ASME Journal of Electronic Packaging, vol. 113, p. 50-57, March 1991.
2. Wijk, J.J. van, A.J.S. Hin, W.C. deLeeuw, F.H. Post, Three Ways to Show 3D Fluid Flow. IEEE Computer Graphics and Applications, vol. 14, no. 5, p. 33-39, September 1994.
3. Cabral, B. and L. Leedom, Imaging Vector Fields using Line Integral Convolution. Proceedings SIGGRAPH�93, Computer Graphics, vol.27, No.4, p.263-270, 1993.
4. Wijk, J.J. van, Spot Noise – Texture Synthesis for Data Visualization. Proceedings SIGGRAPH�93, Computer Graphics, vol.25, No.4, p.309-318, 1991.
5. Leeuw, W.C. de, and R. van Liere, Divide and Conquer Spot Noise. Proceedings Super Computing `97, San Jose, November 1997, ACM SIGARCH.
6. Wijk, J.J. van, Flow Visualization with Surface Particles, IEEE Computer Graphics and Applications, vol. 13, no. 4, p.18-24 , July 1993.
7. Banks, D.C. and B.A. Singer, Vortex Tubes in Turbulent Flows: Identification, Representation, Reconstruction. Proceedings of IEEE Visualization�94, p.132-139, CS Press, 1994.
8. Helman, J.L. and L. Hesselink, Visualizing Vector Field Topology in Fluid Flows. IEEE Computer Graphics and Applications, vol. 11, no. 3, p. 36-46, May 1991.

