As the complexity and power density of electronics systems increase, so too does the demand for tools to improve both product quality and designer productivity. This is especially true for thermal designers who use Computational Fluid Dynamics (CFD) tools for thermal designs. Several important factors are driving this trend:
- System complexity has increased to the point that each part of the system can no longer be designed independently. Changing one part impacts flow distribution throughout the entire system.
- CFD tools allow designers to complete parametric studies for optimizing the design.
- Availability of application-specific CFD tools has made such analysis accessible to the general design community.
However, due to its detailed nature, CFD analysis can prove time-intensive for model definition and computation, especially in the case of large systems. For this reason, the use of CFD early in the design cycle may be premature and impractical due to the design’s “fluid” state. This article describes the technique of Flow Network Modeling (FNM) and the productivity benefits it provides for the design of electronics cooling systems. Traditional use of flow network analysis for designing electronics cooling systems has been discussed by Ellison [1, 2]. The FNM methodology, described in this article, incorporates a completely general method for solving mass, momentum, and energy conservation equations in arbitrarily complex networks to enable efficient analysis of real systems. This paper also outlines an enhanced product development cycle incorporating FNM in the early design stage. Finally, application of FNM for a computer system is illustrated.
The Development Cycle
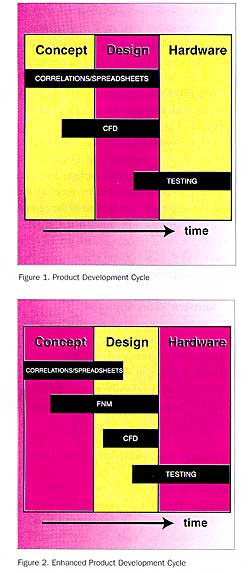
Thermal design has become an integral part of the product design cycle due to the critical need for satisfactory thermal performance and the high cost of modifications later in the design process. Figure 1 shows the conventional development cycle as presented by Biber & Belady [3]. In the current design process, benefits from empirical correlations are limited because of their use in hand calculations or spreadsheets. FNM expands the use of correlations by utilizing them in a flow resistance network that represents the system. During the conceptual and system-level design phase, the number of design alternatives can then be quickly reduced in a scientific and cost-effective manner. This allows focused and economical use of CFD for detailed analysis of the chosen alternatives for the system or parts of the system. The resulting enhanced development cycle is shown in Fig. 2.
What is FNM?
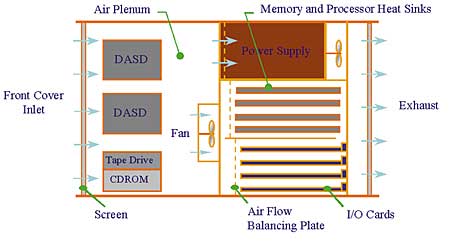
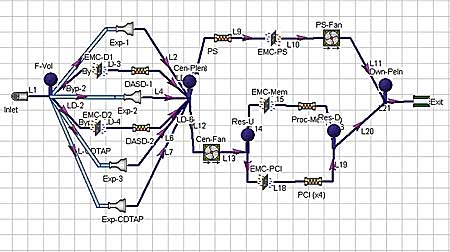
FNM is a generalized methodology that represents a cooling system as a network of components and flow paths, and enables prediction of the system-wide distribution of coolant flow rates and temperatures. Figures 3 and 4 show an example of a computer system and its network representation, respectively. Each network component is represented by an empirical correlation that relates pressure drop and heat transfer rate to the corresponding coolant flow. Therefore, analysis results are accurate to the same level as the empirical correlations used in the model and automatically account for the effect of the flow regime (laminar or turbulent flow), geometry of the component, fluid density and viscosity, and other parameters. In addition, due to the compact representation of components, FNM is effective for model definition (~1 hour) and computation time (~10 seconds on a PC). Thus, the following advantages of FNM make a compelling case for its use as a system-level design tool:
- Evaluation of competing designs – Quick, accurate evaluation of the thermal performance of competing physical layouts.
- New concepts for design improvements – Generation of ideas for design improvements (e.g., incorporation of flow balancing elements, addition of backup fans) and evaluation of their benefits.
- “What if”studies – Investigation of “what if” and contingency scenarios (e.g. fan failure and rise in ambient temperature).
- Use with CFD – Construction of boundary conditions for accurate, focused CFD analysis for subsystems during the detailed design stage.
The user should also be aware of the following limitations of FNM and use CFD where applicable:
- Component temperatures – FNM cannot predict temperatures at the component level. Doing this requires a detailed thermal network, which increases complexity to the level of a CFD analysis.
- Network representation – Construction of a flow network for a physical system requires user insight into the flow paths that the fluid follows as it moves through the system. In addition, flow network representations may not be accurate or even possible for systems in which flow paths are not well defined.
- Flow resistances – The accuracy of FNM results depends upon the validity of the flow resistance correlations employed.
- Passively cooled sealed enclosures – The FNM methodology is applicable for open enclosures cooled by natural convection. However, as described in this paper, FNM may not be applicable to sealed enclosures in which cooling occurs purely by natural convection, unless flow paths can be clearly identified. In both situations, the buoyancy force provides the pumping action analogous to a fan in forced air systems.
Theoretical Basis of FNM
Network Representation and Component Characteristics
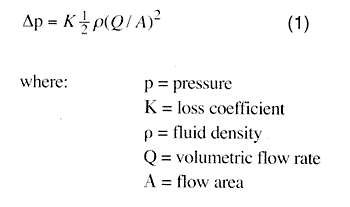
The flow network of an electronic cooling system is constructed by graphically representing the paths followed by the flow streams as they pass through different components of the system. There are no restrictions on interconnections of components in the network or network size. Predicting system-wide flow and temperature distributions requires specification of the flow and heat transfer characteristics for the components used in the network model. The pressure loss in a component can be represented as a function of flow rate with the following equation:
The loss coefficients for standard components (screens, ducts, bends, etc.) are available from handbooks such as Idelchik [4] and Blevins[ 5]. For card arrays, the loss coefficient can be determined using the Moody chart [4, 5] with corrections to account for the blockage effects of heat sinks and electronic components. For nonstandard components, supplier data, CFD analysis, or testing can be used to get the flow characteristics. Performance characteristics of fans and pumps are specified in terms of pressure rise as a function of the flow rate.
Bulk temperatures in different cooling streams are determined from the heat dissipated into these paths as well as mixing of the streams in different parts of the system. Average surface temperatures are determined from the surface heat transfer coefficients. Empirical correlations for the Nusselt number (dimensionless heat transfer coefficient) have the following form:
Solution of the Conservation Equations
Each system component is represented by a combination of links and nodes. Pressure and temperature are calculated at each node while the flow rates are associated with links. The flow characteristics of each link, given by Eq. (1), constitute the momentum equations. Mass conservation is imposed at each node of the network. The forms of the discretized momentum and continuity equations are given below:
Momentum Equation for a Link
The quantities SCR and R are determined by linearizing Eq. (1). Thus, R is the slope ofp vs.Q curve while SCR represents the departure of this curve from a linear variation.
Mass Conservation at a Node

Here n denotes the total number of links at that node.
Calculation of the heat loss/gain in each link, in combination with the imposition of energy balance at each node, determines temperature distribution in the network.
An efficient method to solve momentum and mass conservation equations involves using the “SIMPLE” algorithm of Patankar[6]:
The resulting algorithm is fast and robust.
Example
The FNM methodology has been applied for analyzing the air flow distribution in a typical air cooled computer. A commercially available FNM program [7] was used for this purpose.
The Physical System
The physical layout of the computer system appears in Fig. 3. Two fans provide air flow through the system; i.e., through the DASDs, through the gap between the DASDs, and through the clearance above the tape drive and CD-ROM. These flow streams meet in the central plenum. The fan located in the central plenum forces the flow through the I/O and the memory and processor card stacks. The power supply fan draws some of the air through the power supply.
Figure 3. Layout of a typical computer system
Network Representation
The network representation of the computer system appears in Fig. 4.
Figure 4. Flow network representation of the computer system
In general, there is a one-to-one correspondence between the network layout and the components of the physical system. However, the following network model features require special attention:
- The area expansion components (Exp-1, Exp-2, and Exp-CDTAP), account for pressure losses that occur when the streams from the clearances between the DASDs and above the tape/CD-ROM drives discharge into the central plenum.
- Note that air flows through the I/O and processor/memory card arrays through four flow channels formed by the cards. Accordingly, a multiplier of four is applied to each of these components to represent a set of four resistances in parallel.
Component Characteristics
Loss coefficients for standard components, such as screens, ducts, and area ex-pansions, are available in handbooks [2, 3]. Flow characteristics and heat dissipation rates for the re-maining components are listed in Tables 1 and 2.
|
|||||||||||||||||||||||||||||||||||||||||||
|
|||||||||||||||||||||||||||||||
Results
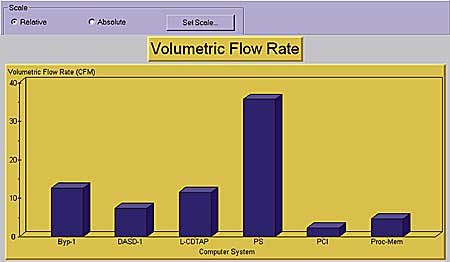
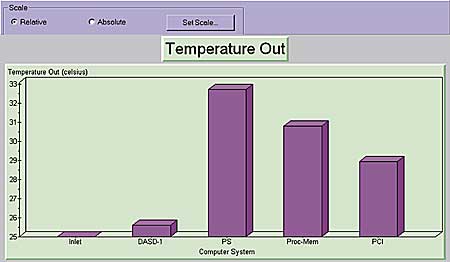
Arrows on the network in Figure 4 denote predicted flow directions. Figure 5 shows the volumetric flow rate through various parts of the system. Flow in the front part of the system bypasses the disk drives due to their large flow resistance. For processor/memory and I/O card arrays, the flow rates reported in Figure 5 pertain to one representative channel within them. Results show that the system is well balanced and provides air flow to the PCI, processor, and power supply components according to their heat flux requirements. Figure 6 shows the bulk temperature of the air streams exiting the heat dissipating components.
Figure 5. Volumetric flow rate through various parts of the system
Figure 6. Bulk temperature of the air streams
Although not reported here due to space limitations, examination of component pressure losses reveals that only the losses through the inlet and the power supply are significant. Incorporation of a separate, more powerful fan downstream of the power supply is necessary to overcome the impedance and provide sufficient flow for cooling.
It is noteworthy that constructing the flow network model required 1.5 hours while calculating the flow and temperature distribution required 10 seconds on a Pentium 133 PC. Thus, this case study illustrates the utility of FNM for rapid and accurate evaluation of coolant flow distribution and thermal performance for system-level design.
Conclusions
This paper introduces the concept of Flow Network Modeling (FNM) and its application in the design of electronics cooling systems. FNM enhances the productivity of the thermal designer by fulfilling the need for a technique between spreadsheets and CFD for system-level design.
A generalized FNM methodology has been described that involves network representation of a flow system by tracing the paths followed by the cooling streams. Each flow path and component in the network is assigned flow and heat transfer characteristics. Then, the mass, momentum, and energy conservation equations are solved to determine system-wide distribution of the flow rate and the local bulk temperature of the coolant. Although the use of FNM approach has been illustrated for the design of an air cooled computer system, a liquid cooled system would be analyzed similarly.
The FNM approach offers the following benefits in the design of electronics cooling systems:
- Rapid and accurate evaluation of competing system configurations during the conceptual design stage.
- Developing ideas for design improvements and analysis of “what if” scenarios.
- Focused, selective, and efficient use of CFD analysis for later detailed design.
References
1. Ellison G.N., Thermal Computations for Electronic Equipment, Robert E. Krieger Publishing Co., Malibar, Florida, 1989.
2. Ellison G.N., “Fan Cooled Enclosure Analysis Using A First Order Method”, Electronics Cooling, Vol. 1, No. 2, pp. 16-19, 1995.
3. Biber, C., Belady C., “Pressure Drop Prediction for Heat Sinks: What is the Best Method?”, Proceedings of InterPACK ’97 Conference, ASME, Mauna Lanai, Hawaii, (1997).
4. Idelchik I.E., Handbook of Hydraulic Resistance, CRC Press, Florida, 1994.5.
5. Blevins R.D., Fluid Dynamics Handbook, Krieger Publishing Company, 1992.6.
6. Patankar S. V., Numerical Heat Transfer and Fluid Flow, Hemisphere, New York, 1980.
7. MacroFlow Users Manual, Innovative Research, Inc., 2520 Broadway Street NE, Suite 200, Minneapolis, MN 55413

