In the standard thermal test environment, thermal test chips are designed to dissipate the applied power uniformly over most of the die surface. However, in many situations of practical interest, the power is dissipated over a localized area of the die. This column provides calculation methods to deal with the latter situation.
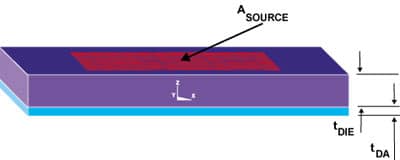
Figure 1 illustrates the situation of interest here: A semiconductor die of thickness tDIE, area ADIE, and thermal conductivity ![]() DIE, is attached to a mounting surface by a thin adhesive layer referred to as a die attach layer, with similarly named parameters: tDA, ADA, and
DIE, is attached to a mounting surface by a thin adhesive layer referred to as a die attach layer, with similarly named parameters: tDA, ADA, and ![]() DA. As is obvious from the Figure, ADA = ADIE. The heat dissipation is presumed to occur over an area ASOURCE, centered over the die area.
DA. As is obvious from the Figure, ADA = ADIE. The heat dissipation is presumed to occur over an area ASOURCE, centered over the die area. The mounting surface is assumed to be of high thermal conductivity, leading to an isothermal boundary condition, TS, at the underside of the die attach layer. The thermal resistance
 ![]() JS, is defined as the total thermal resistance between the top of the die (the junction) and the mounting surface. If this thermal resistance is known, then the peak die temperature could be calculated from the expression
JS, is defined as the total thermal resistance between the top of the die (the junction) and the mounting surface. If this thermal resistance is known, then the peak die temperature could be calculated from the expression
|
In the use of analytical expressions to calculate thermal resistances, there is the continual trade-off between accuracy and complexity. In this column, we have explored the use of the 1-D thermal resistance equation. It is certainly a candidate for the situation here because of its simplicity. We will also explore the use of a more complicated expression that can be used to determine the spreading resistance for heat to flow from the source to the edges of the die, which was developed to deal with localized heat sources in situations involving heat sinks.[1]
The 1-D thermal resistance equation can be applied to calculate thermal resistance values under two sets of assumptions that act as limiting conditions for any actual heat flow pattern:
- The heat flows from the die surface to the mounting surface uniformly over the entire die and die attach area. This represents an optimum heat flow situation.
- The heat flows to the mounting surface only within the die and die attach area immediately under the source area.. This corresponds to a worst case heat flow situation.
The 1-D thermal resistance equation for component X has the form
|
![]() JS can be calculated in these two extreme cases from a simple sum of the die and die attach thermal resistances:
JS can be calculated in these two extreme cases from a simple sum of the die and die attach thermal resistances:
|
In order to take into account the spreading resistance, an extra term is added to this expression:
|
where ![]() DIE and
DIE and ![]() DA are from the 1-D formula calculated in the best case situation (A = ADIE). The spreading resistance is calculated from the more imposing formula [1]:
DA are from the 1-D formula calculated in the best case situation (A = ADIE). The spreading resistance is calculated from the more imposing formula [1]:
 |
where is defined as
|
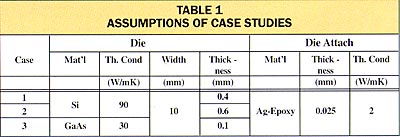
Equations 3 and 4 were applied to calculating the ![]() JS for three situations, whose assumptions are defined in Table I. The first two cases involve a silicon die and the third, a gallium arsenide die. The values of die thickness are typical.
JS for three situations, whose assumptions are defined in Table I. The first two cases involve a silicon die and the third, a gallium arsenide die. The values of die thickness are typical.
![]() JS was calculated using Equation 1, inserting the peak die temperature calculated for TJ. The results of all three calculation methods are listed in Table II.As is evident, the 1-D calculation has better accuracy than the 1-D + Spreading Resistance calculation for source widths down to: 4mm (Case 1); 5mm (Case 2); and 2 mm (Case 3). The apparent conclusion is that the simple 1-D expression is more accurate than the 1-D + Spr. Res. formula for values of ASOURCE near ADIE. The cross-over point extends to smaller values of ASOURCE for die constructions having reduced heat spreading ability – by virtue of reduced thickness or thermal conductivity, or both. For values of the source area below the cross-over point, the error in the 1-D result increases dramatically.
JS was calculated using Equation 1, inserting the peak die temperature calculated for TJ. The results of all three calculation methods are listed in Table II.As is evident, the 1-D calculation has better accuracy than the 1-D + Spreading Resistance calculation for source widths down to: 4mm (Case 1); 5mm (Case 2); and 2 mm (Case 3). The apparent conclusion is that the simple 1-D expression is more accurate than the 1-D + Spr. Res. formula for values of ASOURCE near ADIE. The cross-over point extends to smaller values of ASOURCE for die constructions having reduced heat spreading ability – by virtue of reduced thickness or thermal conductivity, or both. For values of the source area below the cross-over point, the error in the 1-D result increases dramatically.
|
||||||||||||||||||||||||||||||||||||||||||||||||||||||||||||||||||||||||||
|
|
This trend can be put on a more rigorous footing by making use of a non-dimensional parameter, defined herein for the purpose of this analysis. It is constructed to have a high value for situations of high heat spreading and conversely. This parameter is defined as
|
The graphs above indicate the relationship between the error of each calculation and the Spreading Parameter. The error in the 1-D calculation demonstrates a very predictable behavior: for values of the Spreading Parameter in excess of 0.03, the error exceeds 10%. The error in the 1-D + Spr. Res. calculation exhibits a more complicated oscillatory behavior. The error is certainly worse for the GaAs die, the situation studied with the least amount of heat spreading. However, in a


