During the development of a telecommunications product, an unpredictable phenomenon of air streams within the maze of cards and module was encountered. It could only be compared to suddenly confronting powerful inner streams in a calm ocean. Unlike the ocean, however, these streams appeared in a man-made machine. It seemed as if someone had rewritten the laws of physics. It was thus decided to name the phenomenon “The Treacherous Streams”.
Preliminary Cooling Design Issues
To comply with the high quality requirements of telecommunications equipment, this particular product had to withstand an ambient temperature of 45�C, even when one of its six fans failed. (This particular product’s cooling system was designed to operate with N-1 fans. In other words, it normally operates with N fans. If one fails, the product must continue to run satisfactorily until the fan is replaced.)
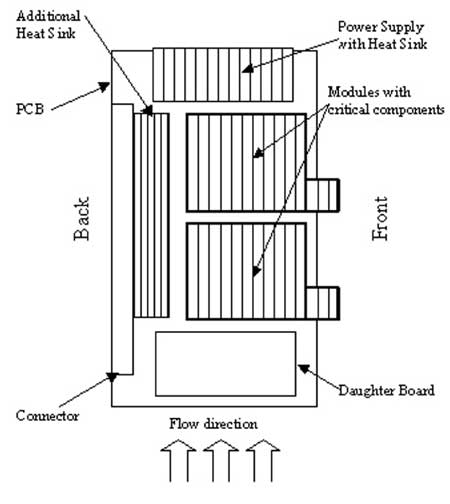
A prototype system was built with all the expected types of cards and components that would most closely simulate the final configuration and parameters, considering the worst cases of thermal condition. One of the cards, dissipating 100W, incorporated two modules, each containing a component having a maximum allowable case temperature of 65�C. These modules were mounted on a daughter board enclosed in an aluminum box with a heat sink.
Analysis showed that the critical area was the 100W card. It was therefore decided to disconnect the fan just below that card to simulate a worst-case fan failure.
 |
Figure 1. 100W card layout
Unexpected Test Results
To test design robustness, the card assembly was monitored during operation with a mesh of thermocouples situated at all critical locations. Of these, the most critical were the modules described above (Figure 1). Toward the end of the test program, one test procedure involved checking how the sixth fan improved thermal performance.
Then, the impossible seemed to happen. To everyone’s astonishment, the thermocouples in the critical region showed a 2�C increase when the sixth fan was turned on.
To ensure that the results were not occasional and that the test set up was correct, the same procedure was repeated several times. The presence of a negative flow through the “failed” fan was verified. In a fully equipped cage, the flow at the slot outlet slot was measured and two major findings were recorded:
- When sixth fan was turned on, the total flow through the slot increased. The flow in the slot is laminar (Re < 2000).
- When the cage was not fully loaded with cards, the phenomenon disappeared.
The conclusion was that the phenomenon resulted from a change in flow direction. Why was this the case?
Further Investigation Warranted
The tools available for the follow-up investigation included:
- The “hot” mock up of the cage
- Thermocouples with data-loggers
- Hot wire air velocity sensors
- CFD (Computational Fluid Dynamics) software
The first idea surmised that if the flow through the module heat sink was reduced when six fans were running, perhaps the air flow was significantly increased somewhere else and, consequently, the temperatures there would be much lower. Unfortunately, temperature measurements did not support this hypothesis.
Investigation of air stagnation with hot wire air velocity sensors was quickly discounted because such devices are designed, built and calibrated to measure uniform flow within a channel.
Flow-visualization facilities would have been advantageous, but were unavailable due to limitations of schedule and budget.
The last hope was CFD.
CFD and Flow Resistance Compact Modeling
The objective was to find a localized phenomenon in the analysis of an entire cage. Meeting this goal necessitated building an exact model of the card cage assembly including precise models of the cards.
However, as anyone familiar with CFD knows, it is virtually impossible to build exact representations because of the extremely high number of grid cells needed to achieve results of acceptable accuracy.
Nevertheless, there is a CFD technique appropriate for such cases – Flow Resistance Compact Modeling.
This technique involves the following tasks:
- Build an exact model of the entity being replaced by flow resistance.
- Run this model within a “wind tunnel” with at least three different air velocities and capture the curve of pressure drop vs. air velocity.
- From this curve, calculate the coefficients of the flow resistance model. (Different CFD software programs provide different ways to calculate these coefficients. These calculation algorithms were published lately by leading CFD software providers.)
- After finding the coefficients, replace the exact model by flow resistance and run the new model in the same conditions of the previous “wind tunnel” to verify the model. (Note, good results are never received from the first attempt and volume resistance coefficients must be adjusted.)
- Once the compact model is verified, use it big system analysis.
Theoretically, this is a very good approach, but it was not adequate in the particular case under consideration because Flow Resistance Compact Modeling was developed for global flow distribution analysis and not for a local phenomenon investigation. Hence, something between exact models and compact models was needed.
The decision was made to build compact models of the heat sinks, daughter boards and screens, and actual size models of the large air blockages.
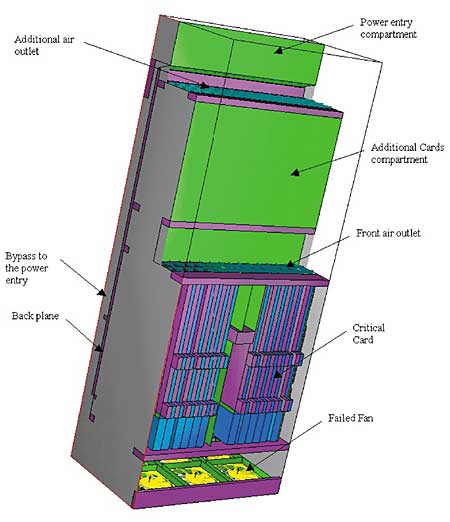
After the “semi-exact” models of the cards were verified, an exact model of the cage was built (Figure 2). This cage, fully equipped with 100W cards, was then analyzed with and without fan failure. As it is seen in Figure 2, the cage consists of several compartments:
 |
Figure 2. Cage geometry analyzed (front door is hidden).
- Fan tray
- Main cards compartment
- Auxiliary cards compartment
- Power entry compartment
- The volume between the back plane and the back of the cage, which allows air to move from the fan tray to the power entry compartment
Results of these two analyses were verified with test data: back flow through the failed fan and air velocities at the outlets of the slots. To reduce the time of iterations, temperature was not taken into account in these analyses.
Further Investigation
For further investigation, the technique of zoom-in solution was used. The tasks involved in this technique are:
- Run the analysis of the big system.
- Determine the slice of the system to be analyzed.
- Measure the parameters of the flow entering this slice.
- Build the detailed model of this slice and define flow sources as they were measured in previous analysis.
- Run the new model and receive results that are more accurate.
In this particular case, using the zoom-in technique also was not so simple. The flow in case of a fan failure was very difficult to define. The solution to this problem was to divide the air inlets into a number of zones with, more or less, uniform flow. In the case of no fan failure, there were only two zones, like two fans. For this analysis, an exact model of the “100W” card was used.
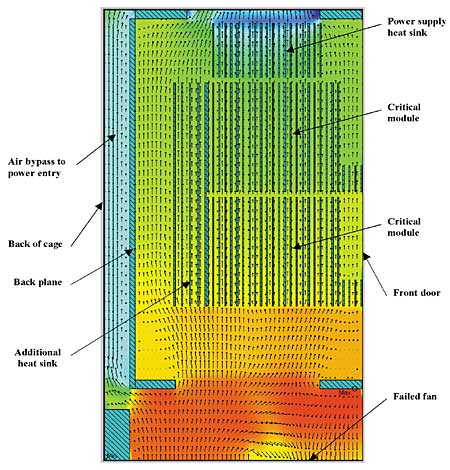
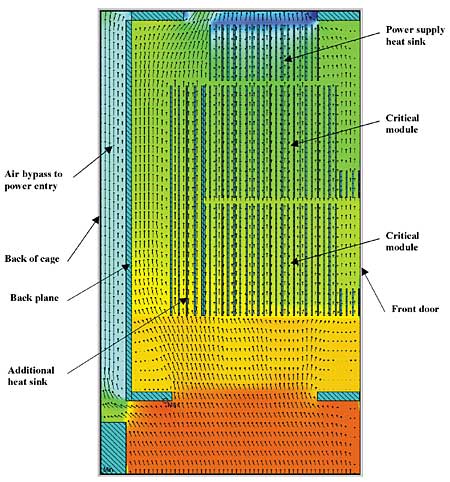
The results of these analyses appear in Figures 3 and 4. With a fan failure, the flow entering the slot was much more uniform than it was without a fan failure when all of the flow was driven to the back of cage.
 |
Figure 3. Fan failure configuration.
 |
Figure 4. Normal operation configuration.The measurement of airflow through the critical module showed that with fan failure the airflow was 20% higher than it was without fan failure. The “additional” flow in the case without fan failure passes through the region of the back plane connector where all the components are passive and through the bypass to the power entry. That explains why changes in temperatures could not be measured in non-critical regions during the test. The colors in Figures 3 and 4 represent pressure distribution.
A Surprising Solution to the Mystery
The end of this story was quite interesting. The solution did not come from the thermal side. When actual cards arrived, it was found that fins of “critical module” heat sink were a bit too long and needed to be shortened by 1.5 mm. The impact of this cut was tested, and the results brought one more surprise. In the case of a fan failure, the temperature in the critical module increased by 1.5�C relative to non-cut fins. In the case of normal operation, the temperature was reduced by 2�C relative to fan failure, meaning a reduction of 4�C relative to normal operation with non-cut fins.
At least physics was back on place.


