Thermal management of electronic equipment is a dynamic process. For example, the anticipated power trends for CMOS technology can be found in the roadmaps of [1 and 2]. They closely follow the rapidly rising power trends seen in the 1980s for the bi-polar circuits [3] but with a time shift by a decade. It is a fortunate circumstance that a tremendous amount of heat transfer understanding generated during the bi-polar semiconductor days could be used directly to help reduce the cycle time in present and future products.
Excellent reviews on heat transfer in electronic systems and related convective heat transfer can be found in [4 through 13].Even though the junction temperatures and ambient conditions or cost and time to market constraints may have changed from the bi-polar days to the CMOS days, the fundamentals of heat transfer and the knowledge-base is really no different. It must, however, be noted that this knowledge-base is vast and complex and has been attained through a large effort and experience of many thermal experts.
Thermodynamically, component temperatures depend broadly on only three factors: powers dissipated in the system, including the component itself; ambient temperature(s) or temperature distribution; and thermal path or resistance between the component and the ambient temperature.
Conceptually this is very simple. However, evaluating the thermal path or the resistance is a complex subject matter, requiring a thorough understanding of heat transfer. This resistance can be affected by a myriad of factors: construction of the components, power distributions within the system, flow (velocity) and temperature distributions in the vicinity of the components, etc.
A summary of thermodynamic/heat transfer considerations for this path can be found in [9]. The ability of the package to conduct heat away does not depend only on its own construction, but also on the materials (see [10] for a review of card and board-effects on junction temperatures), power distributions, as well as flow and temperature distributions around it. Hence non-optimized solutions may be reached if only the package characteristics are studied or relied upon, and system/board level considerations ignored, as shown in [11].
Attempts have been made in the past to separate this total path into a resistance (or combination of resistances) inside the component or package and those that are external to it in order to simplify the analysis or to be able to compare different components on a similar basis.This approach may simplify analyses in many cases, only if thermodynamic factors are understood at all levels.
For example, an excellent approach using resistances, even in extremely complex systems, is demonstrated by Chu et al. in [12] for actual shipped high-end products. Similarly, [13] shows a Monte Carlo approach using resistors.Depending on the understanding and system, resistor network analyses or FEM based or conjugate CFD analysis may be used. For simple systems, such as a module on a card under laboratory conditions, the resistances perhaps could be determined more easily than the complex systems in [12]. However, the usage of these resistances in actual system conditions can be difficult, as illustrated in the example that follows.
System Level Analysis for a Low-End Sector Product
The system chosen for this paper is a typical cost sensitive low-end application. Such systems are characterized by relatively constrained spaces. Wherever possible, passive air cooling is preferred. However, due to the relatively high powers in the present case, low flow-rate forced air is required.
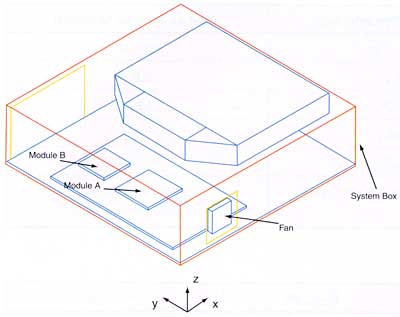
Figure 1. Schematic of the box.
Figure 1 shows the schematic of the electronic enclosure. It consists of a 15cm x 15cm x 5cm box, which houses a 2s2p printed circuit board (PCB) measuring 12.5cm x 7.5cm x 1.5mm. There are two heat generating electronic packages (Modules A and B) on the PCB.Of these, Module A is placed upstream in the airflow. The quantities in Table 1 are the packaging requirements for the two modules. In addition to the above, various functional elements are also part of the system. Since they do not dissipate significant power compared to the modules themselves, only their physical shape is required in the flow/thermal calculations.An ambient temperature of 40oC and an operating altitude of 1500m above mean sea level are specified for the application. Finally, an airflow estimate of 0.5 m/s is provided.
|
Table 1. Packaging Requirements for Modules A and B in Figure 2
In this particular example, Module A was pre-selected to be a cavity wirebond PBGA (Figure 2a). The goal of the designer was to select an appropriate wirebond package for Module B and to design a thermal management scheme for the system so that the junction temperatures given in Table 1 are met within the system constraints. The choice of Module B was narrowed down to the two in Table 1 (see Figure 2 also) through other constraints such as cost, availability, electrical requirements, etc.
Figure 2a. Cavity Wirebond PBGA.
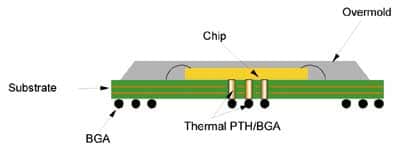
Figure 2b. Chip-up Overmold PBGA.
For most applications, the wirebond Cavity PBGA (Figure 2a) is thermally superior to the wirebond Overmold PBGA (Figure 2b).This is mainly because, in the Cavity PBGA, the chip is directly attached to a high conductivity copper stiffener. This stiffener acts like a heat spreader and provides good thermal paths both to the top of the package as well as to the BGA into the PCB. Heat conduction in an Overmold PBGA (Figure 2b) is somewhat compromised (see JC values in Table 2) due to the plastic overmold covering the chip.However, some thermal enhancement is possible using plated through holes in the substrate placed directly under the chip connecting to the BGA. In this case study, a 1s0p Cavity PBGA and a 2s2p Overmold PBGA (with 36 thermal BGA) are compared as possible candidates for Module B (Figure 1).
|
Table 2. Typical Thermal Performance of a PBGA Overmold Package (shown in Figure 2) Mounted on a 2s2p JEDEC Thermal Test Card at 0.5 m/s Airflow
As a preliminary assessment, consider the Junction-Ambient thermal resistance, JA, for the conditions defined in [17, 18].For the two packages in Figures 2a and 2b,
JA is a function of package and chip size, package construction, and flow conditions. They can be obtained from the references in [21] as 14.9 C/W and 17.9 C/W for the Cavity and Overmold PBGA packages respectively. (Note: For the overmold PBGA, if a solder mask compound is used beneath the chip for electrical reasons,
JA can be significantly higher. The value given is without soldermask.) The thermal characteristics of the two packages are listed in Table 3.
|
Table 3. Module B – Comparison of Cavity and Overmold PBGA According to Conditions in [17, 18] (The card size is 100 mm x 100 mm.)
Column 5 in Table 3 gives the junction temperature of the two packages at the specified conditions. At first glance, it may seem that both the packages meet the TJ requirement of 110oC. However, this calculation is not applicable to the system situation for the following reasons:
1) The effect of the power dissipation in the neighboring module is not taken into account.
2) The size of the PCB in the present system is much smaller than the size of the PCB for which the numbers are specified in reference [18].
3) The flow velocity 0.5 m/s is a “guesstimate”.In reality it is not clear what the actual value is or even if the flow velocity can be approximated to be a uniform constant value.
In order to compare the thermal performance of the Cavity and Overmold PBGAs for Module B, a full system-level analysis was performed.A model incorporating system features like the actual card, fan, vents, a single heatsink (35mm x 77mm x 7mm, 6 fins) for both Modules A and B, and other obstructions was created. The details of individual power planes in the PCB were modeled.
To reduce model complexity, full details of Modules A and B were not modeled. They were instead represented as 2-resistor compact models. The resistor values were determined using detailed models of JC and
JB test conditions. A maximum error of about 10% was obtained when the 2-resistor models were used to simulate a single module on card under forced convection conditions. The numerical analysis was done using Flomerics FLOTHERM thermal analysis software [22]; for general details about the numerical procedure, and algorithm, see [23].The relevant temperature values are summarized in Table 4. The numerical method and results in general were verified experimentally using different form factors than the present system.
Column 4 gives the junction temperature of Module B at the operating power of 3.8W. A Cavity PBGA package for Module B easily satisfies the junction temperature requirements. Further, from Column 5, the Cavity PBGA has an almost 50% higher power dissipation capability than the Overmold PBGA. Table 4 (results for standard laboratory conditions) indicated only a 20% improvement. Clearly, if a Cavity PBGA (which is usually a more expensive option) is chosen for this application, a relatively less aggressive thermal solution is needed for the system.There is thus an opportunity to possibly reduce total system complexity/cost by actually increasing module cost.
|
Table 4. Comparison of Cavity and Overmold PBGA in Realistic System-Level Simulations
Also note in Table 4 how the performance of Module A is affected by the geometry of the package in its vicinity (Module B). The heatspreading effect of the heatsink base causes it to be at a somewhat uniform temperature. This in turn causes the case temperatures of Modules A and B to be nearly equal. When both Modules A and B are Cavity PBGAs, their junction temperatures are also nearly equal due to the small junction-case thermal resistance for Cavity PBGAs. However, when Module B is an Overmold PBGA, its junction temperature is much higher than Module A due to the large junction-case resistance of Overmold PBGAs. For the same reason, the heatsink increases the power dissipation capability of a Cavity PBGA over an Overmold PBGA to a much larger extent (50% vs. 20% – see Tables 3 and 4).
It is thus clear that incorrect conclusions can be reached if a proper system level analysis is not carried out and the thermal designer relies on the standard resistance values determined under laboratory conditions alone. Finally, it should be clear that the thermal management solution does not end with thermal analysis.Often, the mechanical reliability of the solution (e.g., method of heatsink attachment to the modules) should not go unrecognized. It could affect thermal performance of the modules and, ultimately, of the system itself.
Packaging Trends
As one broadens the scope of electronic applications, thermal management poses unique challenges in the design of electronic equipment and components, depending on the end-product sector. Each sector may have unique requirements such as cost, weight, space and thermodynamic considerations due to actual powers, acoustic limits, ambient temperatures and junction temperature requirements. In general however, minimizing the thermal resistance as defined in the JEDEC and SEMI specifications [14 – 18] within the electronics package is a desired goal.
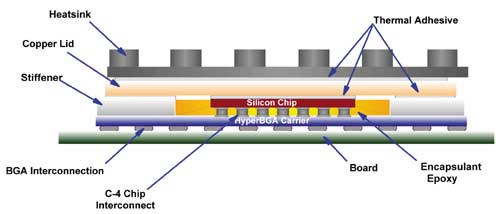
One such package that utilizes techniques to minimize the thermal resistance is the IBM CBGA (ceramic ball grid array) package.It employs the use of a high conductivity grease to enhance the thermal resistance. An example of the thermal transport in the IBM CBGA package can be found in [9] in great detail. Another package which employs several thermal and mechanical enhancements is the HyperBGA flip chip carrier [19, 20]. A cross section of the module is shown in Figure 3.
Figure 3. Cross section of IBM’s HyperBGA flip chip carrier.
A nickel plated copper lid is attached to the chip using a thermally conductive adhesive with a carefully controlled bond-line to minimize JC. The copper lid, having a high thermal conductivity, spreads the heat out well to the air or external heat sink and down to the stainless steel stiffener through a thermally conductive adhesive interface. Mechanically, the copper lid enables the module to remain flat for ease of assembly and the stainless steel stiffener compensates for temperature driven stresses.
The thin carrier (approximately 0.5 mm) and multiple plated through holes in the carrier minimize the JB thermal resistance.The carrier also minimizes stresses in the BGAs, allowing a large range of heat sink sizes to be supported directly by the module. The overall thermal resistance,
JA, ultimately benefits from each of these enhancements, allowing a dual path through the thin adhesive as well as the thin carrier.
Compact models [24] have the potential to be powerful tools in CFD analysis of systems/packages. For the wirebond packages in the low end examples, 2-resistor models were used to represent the packages. This is likely to be accurate due to the presence of a heatsink that provides the primary heat flow path. However, for situations where non-linear effects such as buoyancy or radiation are involved, a more comprehensive approach may be needed. Currently, an industry consortium under JEDEC (www.jedec.org) is involved with validating boundary condition independent compact models for various types of packages.
Summary
In this paper, a practical example of how different parameters affect the thermal performance of a package when approaching it from a system level analysis are shown. Due to the variety of complex factors affecting the thermal performance, it is important to carry out a thorough heat transfer analysis of the component (package). It was shown that relying on the standard parameters obtained from a laboratory test may result in non-optimized solutions in a real application.For example, while figures of merit such as JA are valuable in getting overall trends in thermal characteristics of packages, all relevant details of the system are often required to evaluate each application.
The system-level analysis predicted a bigger difference in application thermal performance than a comparison of figures-of-merit. In addition, mechanical effects can also affect long-term (and short-term) thermal performance and should not be ignored. As a result, a thorough understanding of related flow, thermal, and mechanical issues is required.
References
1. International Roadmap for Semiconductors, Assembly and Packaging, (1999), Semiconductor Industry Association http://public.itrs.net/Files/1999_SIA_Roadmap/Assembly.pdf
2. Azar, K., Morabito, J. (2000), “Managing Power Requirements in the Electronics Industry”, Electronics Cooling Magazine, Vol.6, No.4
3. Delia, D.J., Gilgert, T.C., Graham, N.H., Hwang, U., Ing, P.W., Kan, J.C., Kemink, R.G., Maling, G.C., Martin, R.F., Moran, K.P.,Reyes, J.R., Schmidt, R.R. And Steinbrecher, R.A., (1992), “System Cooling Design for the Water-Cooled IBM Enterprise System/9000 Processors,” IBM Journal of Research and Development, Vol. 36, No. 4, pp. 791-804.
4. Bar-Cohen, A., (1992), “State-of the-Art and Trends in the Thermal Packaging of Electronic Equipment”, ASME Journal of Electronic Packaging, Vol. 114, pp. 257-270.
5. Incropera, F. P., (1992), “Convection Heat Transfer in Electronic Equipment Cooling”, ASME Journal of Heat Transfer, Vol. 110, pp. 1097-1111.
6. Antonetti, V. W. and Simons, R. E., (1985), “Bibliography of Heat Transfer in Electronic Equipment”, IEEE Trans. On Components, Hybrids, and Manufacturing Technology, Vol. CHMT-8, No. 2., pp. 289-295.
7. Schmidt R. R., (1991), “Convection Cooling of Electronic Equipment”, IBM Technical Report, TR 00.3620.
8. Furkay, S. S., (1984), “Convective Heat Transfer in Electronic Equipment: An Overview”, Proc. The International Society for Hybrid Microelectronics, Vol. 7, No. 3, pp. 27-34.
9. Sathe, S. B., Kosteva, S. J., Stutzman R. J. and Sammakia B. G., (1995), “PowerPC 6xx Family of Products – Thermal Management Overview”, IBM TR 01.C780.
10. Sathe, S. B. and Sammakia B. G., (1998), “A Review of Recent Developments in Some Practical Aspects of Air-Cooled Electronic Packages”, ASME Journal of Heat Transfer, Vol. 120, pp. 830-839.
11. Sathe, S. B. and Sammakia, B. G., (1998), “Interaction of the System and Module-Level Thermal Phenomena – A Flip-Chip/BGA Example,” Electronics Cooling, Vol 4., No. 2, pp. 14-22.
12. Chu, R. C., Hwang, U. P. and Simons, R. E., (1982), “Conduction Cooling for an LSI package: A One Dimensional Approach”, IBM Journal of Research and Development, Vol. 26, No. 1, pp. 45-54.
13. Hwang, U. P., Antonetti, V. W. and Keller, C. G., (1981), “Calculating IC Junction Temperatures in a Packaged System”, Electronic Packaging and Production, Vol. 21, pp. 259-265.
14. EIA/JESD51-2, Integrated Circuits Thermal Test Method Environment Conditions – Natural Convection (Still Air), December 1995, www.jedec.org
15. SEMI G30-88, (1990), Test Method / Junction to Case Thermal Resistance Measurements of Ceramic Packages, http://www.semi.org.
16. EIA/JESD 51-8, (1999), Integrated Circuit Thermal Test Method Environmental Conditions Junction-To-Board,http://www.jedec.org.
17. EIA/JESD 51-6, (1999), Integrated Circuits Thermal Test Method Environment Conditions – Forced Convection (Moving Air),http://www.jedec.org.
18. EIA/JESD 51-9, (2000), Test Boards for Area Array Surface Mount Package Thermal Measurements, http://www.jedec.org.
19. Alcoe, D.J., Blackwell, K. and Laine, E., (2000), “Flip-Chip Packaging Reliability Advances”, Advanced Packaging, Vol.9, Issue 6, June 2000.
20. Alcoe, D.J., Jimarez, M.A., Jones,G.W., Kindl, T.E., Kresge,J.S., Libous, J.P., Stutzman, R.J. and Cheryl L. Tytran-Palomaki, (2000), “HyperBGA™: a High Performance, Low Stress, Laminate Ball Grid Array Flip Chip Carrier”, MicroNews, Vol. 6, No. 2, pp. 36, http://www.chips.ibm.com/micronews
21. IBM SA-12E Packaging Databook, http://www.chips.ibm.com/techlib/products/asics/databook.html.
22. FLOTHERM Users’ Manual, Flomerics, Inc.
23. Sathe, S.B., and Sammakia, B., (1996), “A Numerical Study of the Thermal Performance of a Tape Ball Grid Array (TBGA) Package”, ASME HTD Vol. 309, pp. 83-94.
24. Lasance, C.M.J., Vinke, H., Rosten, H., (1995), “Thermal Characterization of Electronic Devices with Boundary Condition Independent Compact Models”, IEEE Transactions on CPMT – Part A, Vol.18, No.4, pp.723-731.


