This article presents an overview of a number of dynamic measurement methods as part of the European PROFIT project. Due to lack of space, details cannot be given, but the interested reader is invited to consult the references at the end of the article. Because the majority of a product’s cost and performance are committed in the early phases of a design cycle, it is envisioned that ‘Virtual Prototyping’ approaches will grow in importance. Central to the success of time-to-market driven electronic products are design methodologies and tools that facilitate first-pass success. In short, the essential point is a timely and accurate predictability of various aspects of quality. For a recent overview of the link between temperature and quality please consult [1].
On January 1, 2000, a new European project, called PROFIT, commenced as a successor to the successfully finished EC-funded projects DELPHI, SEED and THERMINIC. PROFIT is aimed at creating methods and tools that enable a sufficiently accurate measurement and prediction of temperature gradients in time and space. More information can be found in [2] and [3]. The main objective of PROFIT can be stated as follows:
- To provide the designers responsible for yield improvement, performance, reliability and safety with reliable and accurate temperature-related information.
Many tasks utilize mostly time-dependent measurement and analysis methods because dynamic measurements are superior to steady state measurements in terms of speed and accuracy. The major drawback is in the mathematics associated with the analysis of the data. The following section pays attention to an important part of PROFIT: dynamic measurements.
Dynamic Measurements of Important Input Data for Numerical Analysis
Interface Thermal Resistance
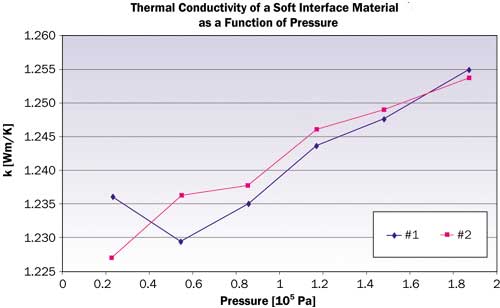
The principle is simple: A sample is fixed between two metal blocks, one of them being subjected to a temperature pulse. The response of the second one is monitored. Thickness variations are measured in situ. Figure 1 shows a sketch. Results are reported with this tester in [4,5]. Since these publications, progress has been achieved in improving the accuracy even further. Sophisticated statistical techniques have been employed to perform sensitivity analyses. At this moment, the thermal resistance can be determined with a relative error of 0.001 K/W (Pentium-size area). Figure 2 shows the thermal conductivity of a soft interface material as a function of pressure, after correction for the contact resistance and the thickness variations due to pressure changes. The two curves represent loading and unloading to detect any hysteresis. Please note the scale: it spans the range from 1.225 to 1.260 W/mK.
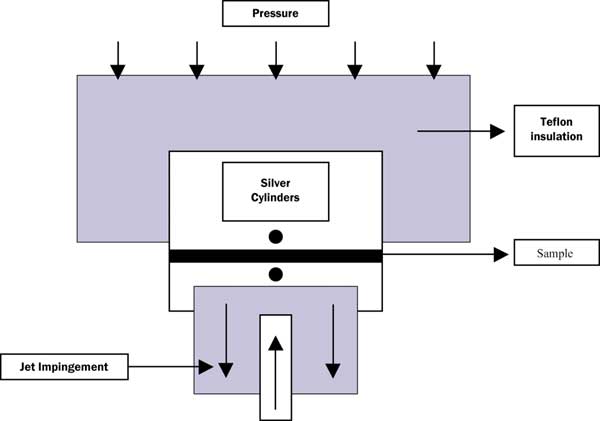 |
Figure 1. Sketch of interface resistance tester.
Figure 2. Graph of thickness-corrected influence of pressure on thermal conductivity of a soft material. #1: loading, #2: unloading.
Emissivity
Generally, the only radiation parameter important for heat transfer is the total hemispherical emissivity [6]. Most methods in use do not measure this quantity, but the normal emissivity in a certain wavelength band. The two values are only identical in the case of a diffuse-gray surface. Unfortunately, ‘practical’ surfaces don’t belong to this class, and errors of the order of 10% can easily show up. Our method is based on the time-dependent heating or cooling of a sample. Figure 3 shows the principle. An evacuated metal housing holding the sample is quickly brought to an elevated temperature. The temperature response of the sample is directly related to the total hemispherical emissivity.
 |
Figure 3. Sketch of emissivity measurement.
Effective Board Thermal Conductivity
This parameter is required because today’s multilayer boards are far too complex to permit analysis of every detail. It can be shown that existing design rules based on averaging procedures for the whole board give rise to large errors. The only way to address this problem is to measure or calculate local average values. One method is described in [7]. A power pulse is locally generated at the surface of the board. Both laser heating and transistor heating have been tested. The local temperature rise is a measure for the effective local thermal conductivity. Another promising method is being pursued by Philips Research, based on extracting a 3D matrix of thermal conductivity values using the board layout directly through a process called homogenization.
Local Heat Transfer Coefficient
While not directly dynamic, the measurement of the local heat transfer from a component to the air and vice versa should be mentioned when discussing input data. The complexity of electronic systems still prohibits the analysis of every detail of the fluid flow, despite the huge progress in computer power. Effects not captured by CFD (computational fluid dynamics) are masked because the uncertainty in the material parameters can be used to ‘tune’ the results [8]. Currently, there is no consensus among experts how serious these problems are. Within PROFIT, a start is made to solve this issue. The method uses accurate measuring blocks, comprising a dissipator, a thermocouple and a guard against losses to the substrate. All material properties are accurately known. A sketch of the set up is shown in Figure 4. The box is situated in a room-within-a-room, of which the last one is temperature-controlled. Measurement results, so far, indicate the extreme importance of keeping the temperature as constant as possible. Deviations from the central plume have been observed, probably caused by minor wall temperature gradients. Also, second-order effects caused by the effect of the substrate heating the local air affecting the ‘adiabatic’ temperature of the component are being studied. The temperature rise of a second non-powered block located downstream is believed to provide a more sensitive criterion to validate the CFD code than the heated block. In time, the set up will be extended to forced convection and multiple components.
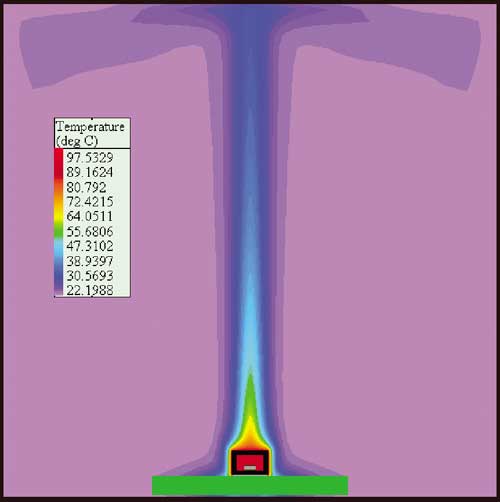 |
Figure 4. Sketch of natural convection benchmark for CFD.
Package Thermal Resistance
Obviously, it does not make sense to improve the accuracy of the material properties and the CFD analysis without also considering the thermal data of the components. It is in this area that DELPHI and SEED achieved important success through the introduction of boundary-condition-independent compact models. Recent progress can be found in [9,10].
Dynamic measurements are an important tool to assess package quality, validate detailed models and construct compact models, using either test or functional dies. Currently, a wealth of information is available in the open literature [11,12,13,14]. A few highlights are presented below. Figure 5 shows a processed temperature response of an Intel processor. Basically, the temperature-time response curve (See Figure 6) is mathematically transformed into a curve that clearly distinguishes the various parts of the component. The horizontal axis shows the thermal resistance, from left to right, going from the junction to the ambient. The vertical axis is related to the cross-sectional area of the heat flow path. The distance between the maxima of the curve provides information about the thermal resistance of distinct parts of the package.
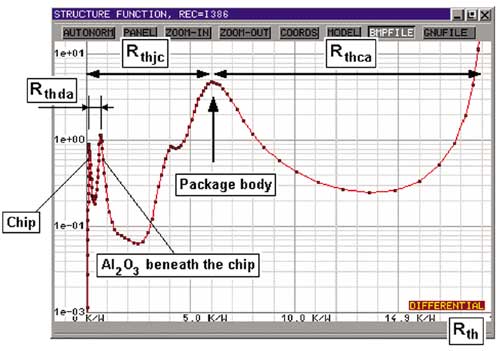 |
Figure 5. The differential structure function for an Intel processor, showing various package characteristics.In [10], improvements realized with a transient thermal tester developed for time-dependent measurement of test dies and functional dies are discussed. A promising approach to extract compact models directly from measurements is treated in [11]. The basic idea is to use various Double-Cold-Plate measurements generating different thermal responses in the time-domain, as illustrated in Figure 6. By transformation to the frequency domain, the authors showed the possibility of extracting a compact model that fitted all tested boundary conditions. The detection of die attach and solder problems is treated in [12].
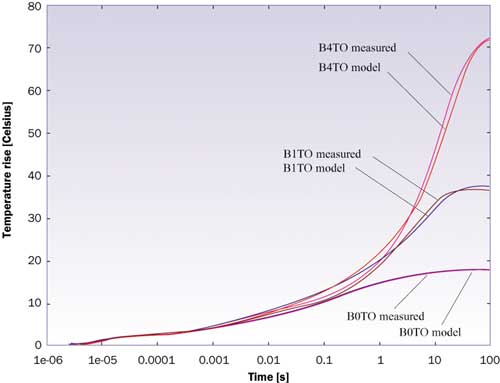 |
Figure 6. Comparison between experimental and dynamic compact model results for three different boundary conditions.Figure 7 shows a clear distinction between a reference package and one with a failure. The graph shows two curves of the kind plotted in Figure 5. The difference between the two curves can be attributed to a die attach problem caused by voids. The location of the die attach is indicated by the numbers 1 and 1′. The distance between the peaks is equal to the change in resistance. How to correct for various nonlinear effects is dealt with in [14].
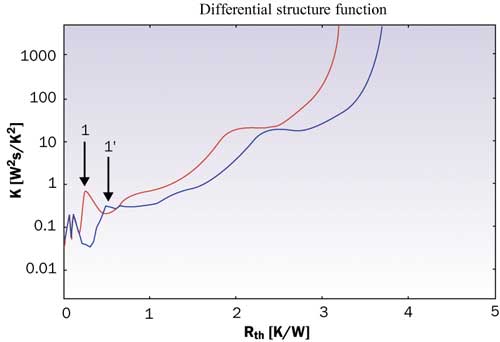 |
Figure 7. Differences between processed temperature responses indicating die attach failure. The shift of peak 1 equals the increased thermal resistance.Finally, a related topic worth mentioning involves ‘intelligent’ test dies [15,16], enabling high-resolution measurements.
Conclusions
Hopefully, the discussed examples provide evidence that dynamic measurements are very promising for a large variety of subjects that are of interest for thermal management of electronic parts and systems. From a physical property measurement point of view, dynamic methods are inherently more accurate and faster. From a package analysis point of view, dynamic measurements enable the extraction of much more information than is ever possible using steady state measurements. The major disadvantage is that the mathematics are much more complex. But then, that is why computers were invented.
References
- Parry, J., Rantala, J., Lasance, C., “Temperature and Reliability in Electronic Systems – the Missing Link?”, ElectronicsCooling, Vol.7, No.4, 2001, pp. 30-36.
- Lasance, C., “The European Project PROFIT: Prediction of Temperature Gradients Influencing the Quality of Electronic products”, Proceeding of the 17th SEMITHERM, San Jose, 2001, pp. 120-125.
- PROFIT: www.extra.research.philips.com/euprojects/profit/
- Bosch, E. and Lasance, C., “Accurate Measurement of Interface Thermal Resistance by Means of a Transient Method”, Proceedings of the 16th SEMITHERM, San Jose, 2000, pp.167-173.
- Bosch, E. and Lasance, C., “High Accuracy Thermal Interface Resistance Measurement”, ElectronicsCooling, Vol.6, No.3, 2000, pp. 26-32.
- Siegel, R. and Howell, J., Thermal Radiation Heat Transfer, Chapter 3, McGraw-Hill, 1972.
- Sz�kely, V., Rencz ,M., T�r�k, S., Ress, S., Vizy, B., “Experiments on Effective Board Thermal Conductivity Measurements”, Proceedings of the 6th THERMINIC, Budapest, 2000, pp. 26-30.
- Lasance, C., “The Conceivable Accuracy of Experimental and Numerical Analyses of Electronic Systems”, Proceedings of the 17th SEMITHERM, San Jose, 2001, pp.180-198.
- Guenin, B., “Component Thermal Characterization”, ElectronicsCooling, Vol.7, No.1, 2001, pp. 36-44.
- Bosch, E. and Sabry, N., “Thermal Compact Models for Electronic Systems”, accepted for the Proceedings of the 18th SEMITHERM, San Jose, 2002.
- Sz�kely, V., Farkas, G., Nikod�musz, E., Rencz, M., Ress S., and T�r�k, S., “New Procedures for Thermal Transient Testing”, Proceedings of the 6th THERMINIC, Budapest, 2000, pp. 15-19.
- Rencz, M., Sz�kely, V., “A Generic Method for Thermal Multiport Model Generation of IC Packages”, Proceedings of the 17th SEMITHERM, San Jose, 2001, pp. 145-152.
- Rencz, M., Sz�kely, V., “Determining Partial Thermal Resistances in a Heat-Flow Path with the Help of Transient Measurements”, Proceedings of the 7th THERMINIC, Paris, 2001, pp. 250-255.
- Sz�kely, V., Rencz, M., Pohl, L., “Novelties in the Theory and Practice of Thermal Transient Measurements”, Proceedings of the 7th THERMINIC, Paris, 2001, pp. 239-244.
- Poppe, A., Farkas ,G., Rencz, M., Benedek, Z., Pohl, L., Sz�kely, V., Torki, K., Mir, S. and Courtois, B., “Design of a Scalable Multi-functional Thermal Test Die with Direct and Boundary Scan Access for Programmed Excitation and Data Measurement”, Proceedings of the 6th THERMINIC, Budapest, 2000, pp. 267-272.
- Rencz, M., :The Increasing Importance of Test Dies”, ElectronicsCooling, Vol.6, No.3, 2000, pp. 34-42.

