It is often necessary to generate in-house pressure-drop and base-to-ambient thermal resistance data for ducted fan/heat sink assemblies. For reliable applicability of the performance data, the configuration of the test article should closely match the intended application so that the test article coolant flow characteristics (turbulence level, 3-dimensionality, etc.) match that of the application. Under these conditions, measurement of the coolant flow rate is problematic since insertion of an obstruction meter, such as a laminar flow element, into the fan/heat sink test article coolant flow path will introduce an extra flow resistance, so that the operating point of the test article will be altered. This difficulty can be circumvented by using the test article fan, in conjunction with its performance curve, to determine the flow rate through the system. Only two easy measurements are required: the fan speed and the pressure rise across the fan.
Fan Performance Models
A dimensional analysis leads to universal functional relationships that describe the pressure rise – flow discharge characteristic of a fan or blower. This is useful since the performance characteristic is reduced to a single curve for a given family of different size but “geometrically similar” fans operating at different speeds with different density fluids. These relationships are often called “fan laws”. Assume the pressure rise across the fan, P, depends on: air volume discharge rate, Q; fan rotational frequency, w; fan diameter, d and thickness, t; and, air density,
.
A dimensional analysis of Eq. (1) gives the characteristic equation for the fan
 |
where CP =
P/
d2w2 is the dimensionless pressure rise across the fan, and CQ=Q/d3w is its dimensionless discharge. The ratio t/d emphasizes that each equation applies only to “geometrically similar” members of the family (same t/d, number of blades, relative hub size, etc.).
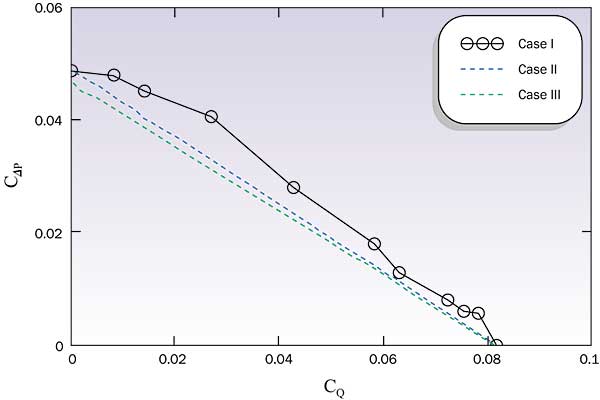
Case I: Detailed Performance Model. We can construct the explicit form of Eq. (2) for a family of geometrically similar fans if we know the “fan curve” (P – Q) of one member of the family at one operating condition (fan speed and air density). For example, consider a small axial flow fan having a fan shroud diameter, d = 52 mm, and a thickness, t = 10 mm. When this fan is operated in air at STP (
= 1.2 kg/m3) at a rotational speed of 3600 rpm (w = 377 Hz), it has a maximum free delivery of Qmax = 0.26 m3/min; and its shut-off pressure rise is
Pmax = 2.3 mm H2O. The fan consumes Pw(0) = 1.2 W when operated at 3600 rpm, maximum free delivery (
P = 0).
Figure 1 shows the dimensionless characteristic curve of the fan (labeled “Case I” in the Figure). The curve was constructed by scaling eleven P – Q points from the manufacturer-supplied “fan curve” and translating them into a C
P – CQ tabulation.
 |
Figure 1. Fan performance models.
Piecewise linear interpolation of this tabulation then gives an approximation of Eq. (2).
 |
The Case I characteristic has CPmax =
Pmax/
d2w2 = 0.0488 and CQmax=Qmax/d3w = 0.0817. Equation (3) can be used to construct the “fan curve” for any member of “geometrically similar” fans operating at any speed with any air density.
Case II: Linear Performance Model. Detailed fan characteristics, such as Case I shown in Figure 1, are not always available for small axial-flow fans. Instead, the manufacturer may only supply Pmax and Qmax for a given operating condition (w,
). In this case, it is useful to approximate the actual fan characteristic curve with a linear relation,
 |
For the example fan considered above, this performance model is shown as Case II in Figure 1.
Case III: Generic Axial-Flow Fan Performance Model. The availability of a reliable model of generic axial-flow fan performance allows preliminary design decisions to be made before specific hardware is identified.Wirtz and Zheng [1] surveyed manufacturer supplied specifications of 312 small DC axial-flow fans having shroud diameters ranging from 30 to 171.5 mm while the fan thickness ranged from 9 to 50.8 mm. Input power ranged from 0.35 to 29 W. Pmax ranged from 1.02 to 20.3 mm H2O while Qmax ranged from 0.04 to 6.65 m3/min. Their correlation of fan characteristics can be written as
 |
where Cpw = Pw(0)/d5w3 is the power coefficient and Pw(0) is the fan input power when the fan is operated at Qmax (
P = 0).
Equation (5) can be used to size a generic axial-flow fan for a given application. For example, consider our sample fan, having a 52 mm shroud diameter and 10 mm thickness operating at STP ( = 1.2 kg/m3) with w = 3600 rpm and Pw(0) = 1.2 W. Assume Qmax = 0.26 m3/min. Then CQmax = 0.0817 and Cpw = 0.0491. Eq. (5) gives C
Pmax = 0.0456, so
Pmax = 2.15 mm H2O, which is approximately 6.5% lower than the actual maximum pressure rise of the example fan. Equation (5) can be used in conjunction with Eq. (4) to give a generic fan performance model. This approximation to this fan’s performance is shown as Case III in Fig. 1.
Heat Sink Characterization
It is often necessary to generate in-house pressure-drop and base-to-ambient thermal resistance data for specific heat sinks. The principal measurements include the pressure drop across the heat sink, Phs ; the heat transfer rate, q; the heat sink base-to-coolant temperature rise, Tb – Ta ; and, the coolant flow rate, Q. Then, the heat sink overall thermal conductance is given as
 |
Note that when the overall conductance is defined in this way, it includes both the convective resistance and the conductive resistance to heat flow within the heat sink.
For reliable applicability of the performance data, the configuration of the test article should closely match the intended application so that the test article coolant flow characteristics (turbulence level, 3-dimensionality, etc.) matches that of the application. For example, if the fan or blower is immediately adjacent to and upstream from the heat sink in the intended application; then, the test article should be configured in the same way. Under these conditions, measurement of the coolant flow rate is problematic since insertion of an obstruction meter, such as a laminar flow element, into the fan/heat sink test article will introduce an extra flow resistance, so that the operating point of the test article will be altered.
Wirtz and Zheng [1] propose an alternative procedure to measure the coolant flow rate where the test article fan together with a measurement of the fan speed and the pressure rise across the fan is used to determine the flow rate. The procedure links the fan characteristic equation (Case I) to the fan pressure rise in the determination of fan/heat sink-assembly operating point. In studies of fan-driven flow impinging on square arrays of circular cross section pin-fins, Zheng and Wirtz [2] find that the volume flow rate (system operating point) can be determined to within about �7% (95% confidence-level) using this technique. In these experiments, they measure the fan speed with a strobe-tach (�100 rpm accuracy); and, the pressure rise across the fan is measured with an electronic manometer having an accuracy of �0.09 mm H2O.
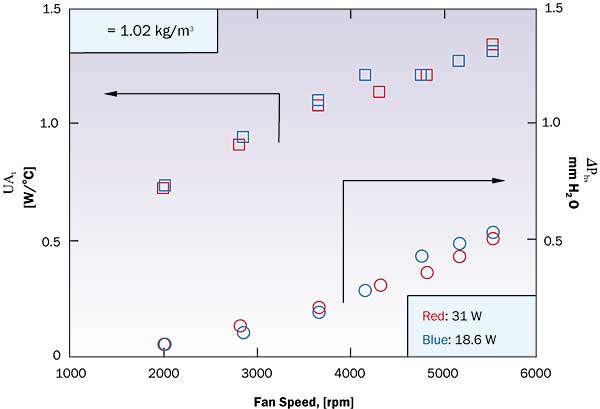
Data analysis example.Figure 2 shows some partially reduced data collected from a fan/heat sink test article that consists of the fan described in the previous section attached to the top of a crosscut extruded aluminum heat sink such that the fan discharge impinged directly onto the top of the heat sink. The heat sink consists of an 11 x 12 array of approximately rectangular cross section, tapered pin fins that have a height of 16.8 mm and an average fin hydraulic diameter of 2.4 mm, on a nearly square footprint which is approximately L = 53 mm on edge.
 |
Figure 2. Fan/heat sink test article data.
The total heat transfer surface area of the heat sink is estimated to be At = 241.6 cm2. It should be noted that the test article was configured so that the pressure rise across the fan equaled the pressure drop across the heat sink (P =
Phs). Tests were conducted at Reno, Nevada (1370 m altitude) where the air density is approximately
= 1.02 kg/m3.
The Figure summarizes two sets of measurements where the heat transfer rate was maintained at q = 18.6 and 31 W, respectively. The fan speed was varied from 1980 to 5500 rpm, resulting in pressure drops across the heat sink ranging 0.051 to 0.533 mm H2O.The corresponding overall thermal conductance (UAt) ranged from 0.72 up to 1.33 W/oC. The data shows that buoyancy forces were apparently negligible in that data for the two tests are essentially coincident.
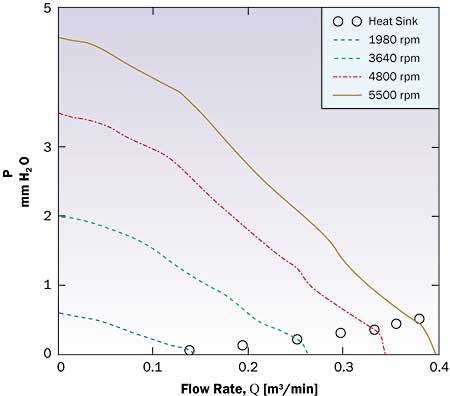
The volume flow rate at each fan speed is easily determined. Given a data point ( = 1.02 kg/m3, w,
P), find Q that satisfies Eq. 3. This can be done on any spreadsheet calculator having a root-finding algorithm. The solution is the operating point of the fan/heat sink test article at given fan speed.The resulting operating points for the seven data points with q = 31 W are shown in Fig. 3. The “fan curves” for four of the data points (fan speeds equal 1980, 3640, 4800, and 5500 rpm) are superimposed on the figure.
 |
Figure 3. Determination of heat sink coolant flow rate.
This data illustrates the importance of using the non-dimensional form of the Fan Law instead of the dimensional “fan curve” for the fan. Note the fan/heat sink test article operating point at 3640 rpm. At an altitude of 1370 m ( = 1.02) the fan achieves
Pmax
2.0 mm H2O whereas at sea-level the fan would achieve
Pmax
2.3 mm H2O.Use of the manufacturer-supplied fan curve (for STP operation) would over-predict the flow rate of the current test example.
The data could have been analyzed using the Case II or Case III performance models if a detailed fan curve were not available.With the present fan, with nearly linear characteristics, and operating with a low flow resistance system, this would shift estimated flow rates downward by about 7%.
 |
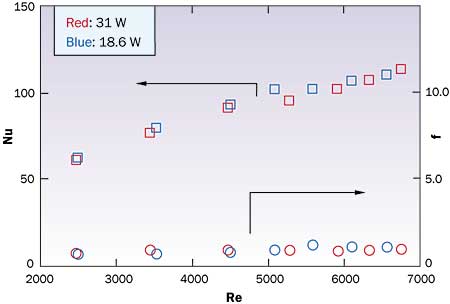
Figure 4. Fan/heat sink test article reduced data.
Figure 4 shows the final reduced dataset with heat sink conductance and pressure drop expressed in terms of Nusselt number, Nu and friction factor, f plotted as a function of Reynolds number, Re
 |
where kf and � are the thermal conductivity and viscosity of air, respectively. Representation of the data in non-dimensional form is necessary if the results are to be applied to an application having a different ambient pressure and temperature than existed at the Reno-lab. In this case, the results show that the heat sink Nusselt number increases approximately linearly with Reynolds number while the friction factor is essentially constant.
References
1. Ning Zheng, Wirtz, R.A., “Cylindrical Pin-Fin Fan-Sink Heat Transfer and Pressure Drop Correlations”, IEEE Transactions, Components and Packaging Technology, Vol. 25, 2002, pp. 15 – 22.
2. Wirtz, R.A., Ning Zheng, “Methodology for Predicting Pin-Fin Fan-Sink Performance”, Proc. Sixth Intersociety Conference on Thermomechanical Phenomena in Electronic Systems, 1998, pp. 303 – 309.


