Previous installments of this column have all dealt with situations in which the die temperature was assumed to be at a constant temperature after the system had achieved the steady state. However, there are many times in which it is useful to know how rapidly the temperature of the chip changes when the applied power changes abruptly. This month’s column presents a simple method of calculating the temperature versus time curve during the power-on cycle, using the commonly available thermal metrics, JA and
JB [1,2].
The method will be demonstrated using a thermally-enhanced BGA package containing a copper-alloy heat spreader attached to a JEDEC-standard, multilayer thermal test board. The package and board are illustrated in Figure 1. The steady-state heat flow paths are represented by the arrows.
 |
We can readily imagine the progression of temperature rises during the power-on process. As the power is initially applied, the die is the first component to heat up, storing a portion of the dissipated power as thermal energy. The portion of the power which is not stored will flow to the heat spreader through the thermally-resistive die attach layer.The heat spreader and adjacent Cu ring, because of their mass, must absorb a measure of heat before their temperature will rise sufficiently to drive the heat through the subsequent thermal paths. This process is continued until the temperatures have risen to their steady-state values and all of the dissipated power will flow to the air with no additional power being stored as thermal energy.
A thermal circuit diagram accounting for the transient heat flow would represent the regions of heat storage as capacitors and those offering resistance to heat flow as resistors. Such a thermal circuit diagram representing all of the resistive heat flow paths and thermal capacitances can contain 5 – 10 each of resistors and capacitors [3]. Such a detailed analysis is beyond the scope of this article. Here we will explore two simple representations of the package and board: a circuit with one RC stage and another with two stages. In spite of their simplicity, they are very useful in predicting changes in die temperature. Now some preliminaries.
Calculation of Thermal Capacitance
Component at a Uniform Temperature
This calculation applies to components in which the temperature is relatively uniform, such as the die, heat spreader, or the region of the board directly under the package. The thermal capacitance, C, is a simple function of the heat capacity of the material, cp , its density, , and its volume, V.
Component with Exponential Temperature Distribution
This calculation is applied to the portion of the board beyond the package, in which the temperature decreases exponentially with increasing distance from the edge of the package. It involves calculating the quantity, x1/2, defined as the distance from the edge of the package to the point at which the board temperature decreases to half of its peak value. This distance is a function of the thermal conductivity of the board, BRD, the board thickness, dBRD, and the heat transfer coefficient, h [3].
 |
The assumption is that the thermal capacitance of the non-uniformly heated portion of the board can be represented by a uniformly heated region bounded by the package outline and a distance equal to x1/2 on all sides of the package. Hence, the thermal capacitance can be calculated using Eqn. 1, using for the board volume, VBRD, the value
where WPKG is the width of the package. It is clear that conditions which will promote greater heat spreading in the board (larger BRD or dBRD or smaller h) will increase the effective thermal capacitance of the board.
Thermal Circuit Diagrams
One-Stage RC Network
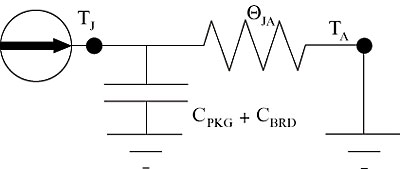
The simplest thermal network imaginable would associate all of the thermal resistance from the package via the board to ambient with a single resistance and all of the capacitance of the package and board with a single capacitance. Such a network is illustrated in Figure 2. The total thermal resistance is represented by JA.The total thermal capacitance, CTOT, is equal to the sum of the package and board thermal capacitances, CPKG and CBRD.
 |
The standard solution to this network will yield a time dependence of TJA of
where TJA,STEADY STATE is equal to Power �
JA and the time constant,
, is equal to RC, or, in thermal terminology,
JA � CTOT. For a one-stage RC circuit,
represents the time for
TJA to achieve 0.63 of its steady-state value.
Two-Stage RC Network
The next simplest RC network would represent two components, each by its own value of R and C. It is a very natural step to select the package as one component and the board as another. Figure 3 depicts such a network. As would be expected, CPKG and CBRD are each assigned to separate capacitors.The values assigned to the resistors require additional discussion.
 |
As can be seen from Figure 1, not all of the dissipated power will flow to the board. A portion of the heat will flow directly from the top of the package to the air. However, in most cases, this will represent only a small fraction of the total power and the network of Figure 3 will represent the primary heat flow path.
The JEDEC-defined thermal characterization parameter, JB , equals
TJB/Power and is measured under conditions in which there is heat loss out the top of the package [2]. Hence a resistor assigned the value of
JB would accurately yield the correct value of
TJB when multiplied by the total power.
Furthermore, we can define a second thermal characterization parameter, BA, which would account the temperature difference between the board and the air. The sum of these two parameters equals
JA:
Hence, JB and
JA provide the appropriate values of resistance when the heat flow is represented using only two resistors.
The time dependence of TJA can be calculated with reasonable accuracy from
 |
where time constants: 1 =
JB � CPKG and
2 =
JA � (CPKG + CBRD). Note that this is not a general result for an arbitrary 2-stage RC network. Its derivation was based upon the assumption that
2 >>
1, a situation typical of this sort of problem. The reader is directed to Ref. [4] for a more rigorous derivation of multi-stage thermal networks.
Calculation of Transient Response of 40 mm Heat-Spreader BGA Package
The above equations can be ready applied to a 40 mm heat-spreader BGA package, as depicted in Figure 1. The material properties needed for the thermal capacitance calculations are furnished in Table 1.
|
||||||||||||||||||||||||
Table 1. Material Properties
Package Thermal Capacitance
Given the accuracy objectives of this calculation, it is sufficient to account for the chip and the more massive metallic package components. The resultant values of thermal capacitance are displayed in Table 2, calculated using Eqn. 1, inputting the indicated package component dimensions and the above material properties.
|
||||||||||||||||||||||||||||||||||||||||||||||||||||||||
Table 2. Calculation of Package Thermal Capacitance
Package Steady-State Thermal Performance
The measured values of thermal performance are shown in Table 3.
|
||||||||||||||||||
Table 3. Thermal Measurement Results
Board Thermal Capacitance
Table 4 provides the inputs to Eqn. 2 and the resultant values of x1/2 and the effective width of the heated board area, WPKG + 2 � x1/2. The values of BRD and h are calculated using methods described in previous installments of this column [5,6].
|
||||||||||||||||||
Table 4. Calculation of Effective Width of Heated Board Area
Thermal Transient Response
The thermal time constants can be calculated with the appropriate parameters displayed above.One-stage network: = 204 sec. Two-stage network:
1 = 18.2 sec. and
2 = 204 sec.
|
||||||||||||||||||||||||||||||||||||
Table 5. Calculation of Thermal Capacitance of Heated Board Area
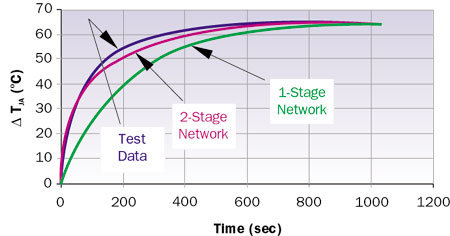
The resultant curves are calculated using Eqn. 4 for the 1-stage network and Eqn. 6 for the 2-stage network and are compared with measured data in Figure 4. It is quite obvious that the 2-stage model much more accurately represents the transient response of the package than the 1-stage model.
 |
The thermal time constant of the various curves represents the time to reach 63% of steady-state value. The calculated values of the time constant are: test, 76 sec.; 1-stage, 197 sec. (160% error); 2-stage, 87 sec. (15% error). The maximum temperature difference between the test results and the two models is: 1-stage, 20oC; 2-stage, 4oC.
Conclusions
The transient behavior of a heat-spreader package can be calculated with quite acceptable accuracy using a 2-stage network, applying standard thermal metrics and easily calculated values of thermal capacitance. It is expected that the method will work best with packages whose thermal capacitance is dominated by metallic components for which the thermal capacitance calculations have little uncertainty. This method is not expected to accurately predict values of TJA for elapsed times of less than a few seconds. To achieve precision in this short-time regime, the thermal capacitance of the die and the thermal resistance coupling it to the package must be separately accounted for in a 3-stage model.
References
- Guenin, B., “Determining the Junction Temperature in a Plastic Semiconductor Package, Part I,” Electronics Cooling, Vol. 5., No. 2, May, 1999.
- Guenin, B., “Determining the Junction Temperature in a Semiconductor Package, Part III — The Use of the Junction-to-Board Thermal Characterization Parameter,” Electronics Cooling, Vol. 6., No. 2, May, 2000.
- Guenin, B., “Transient Thermal Model for the MQUAD® Microelectronic Package,” Proceedings SEMI-THERM X Conference, February, 1994, pp. 86-95.
- Xu, Y-L, Stout, R., and Billings, D.,”Electronic Package Thermal Response Prediction to Power Surge,” Proceedings, I-Therm Conference, May, 2000, pp. 366-371.
- Guenin, B., “Conduction Heat Transfer in a Printed Circuit Board,” Electronics Cooling, Vol. 4., No. 2, May, 1998.
- Guenin, B., “Convection and Radiation,” Electronics Cooling , Vol. 4., No. 1, January, 1998.


