High-density hardware and software are developed as part of an initiative to greatly increase data center compute densities. Concept systems presented here are based on the Intel® Itanium™ processor family and are designed for a 1U rack-mount form factor. The current dual-processor system concept is targeted at the front-end server market (e.g., web hosting and mail routing), at processing secure transactions, web or database searching, or acting as a “compute server” (see Figure 1 and [1]). The primary architectural advantages are massive compute power, large memory address space, rich I/O connectivity, and a dense form factor. The expected deployment environment is the air-cooled, rack-mount data center.
However, the nameplate thermal power density of 700 W greatly exceeds commercially available air-cooled servers – thus, thermal optimization of this system presented significant design challenges. A careful program of numerical simulation, parametric analysis, laboratory prototypes, and experimental verification yielded a system architectural solution based on air-cooling techniques, conventional heatsinks, and the inclusion of a custom-designed radial blower. Areas to be discussed in this paper include:
- Processor thermal management and the modeling of vapor chamber base and solid heatsinks
- Air mover design considerations and the performance and modeling of radial blowers
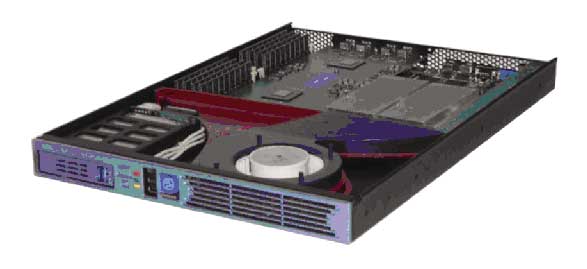 |
Figure 1. 1U concept server system studied in the presented work.
Processor Thermal Management
As the concept server is designed around a 16″ x 14″ (40.6 cm x 35.6 cm) baseboard, real estate on the main board is at a premium. An integrated voltage-regulating module (VRM) that mounts around each processor and dissipates heat into a shared heatsink (Figure 2) has been developed [1]. Due to the packaging constraints of the 1U chassis, and to better handle the increased thermal load, several heatsink designs were considered, including vapor chamber, copper, or aluminum bases, and with aluminum fin counts ranging from 26 through 44. In order to develop the required air-mover solution, the required airflow volume and flow resistance properties of the proposed heatsink must be determined.
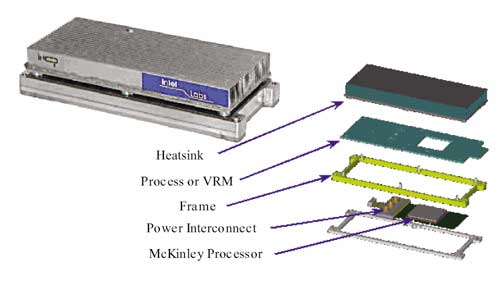 |
Figure 2. Heatsink stack-up for processor and integrated VRM.
Baseline Case – Vapor Chamber Heatsink
To confirm that numerical findings would be a useful predictive tool in the following analysis, simulation and experimental data were generated for a baseline heatsink configuration, namely, a vapor chamber base, folded copper fin heatsink. An advantage of using this as a baseline was that a thermal performance equation, based on empirical data for sa, was available:
 |
First, a numerical model of the vapor chamber heatsink was created with a commercially available computational fluid dynamics software program [3]. The heatsink was constructed from the appropriate module in the software, and the solution domain set to simulate a closely ducted (no bypass) condition.
To simulate a vapor chamber base for this heatsink, a methodology similar to that of Thayer [4] was employed. A copper cuboid was put into the model with dimensions of the vapor chamber outline. Then, a high thermal conductivity (K = 30,000 W/mK) cuboid was created corresponding to the vapor chamber interior. Finally, a collapsed cuboid with thickness of 1mm and thermal conductivity of 40 W/mK was inserted as a wick.
A simple processor model was imported and aligned to the heatsink bottom surface, and a TIM layer was inserted between the processor and the heatsink base, with properties set to achieve a cs of 0.05 oC/W. Ambient conditions were set to 35oC and 5000′ (1524 m) elevation.To experimentally measure case temperature as a function of flow rate, an instrumented processor thermal test vehicle and vapor chamber heatsink were installed in a calibrated wind tunnel, with the test-section sides and top adjusted to achieve minimal bypass. Experimental data were altitude-corrected to allow direct comparison with empirical and CFD predictions (Figure 3).
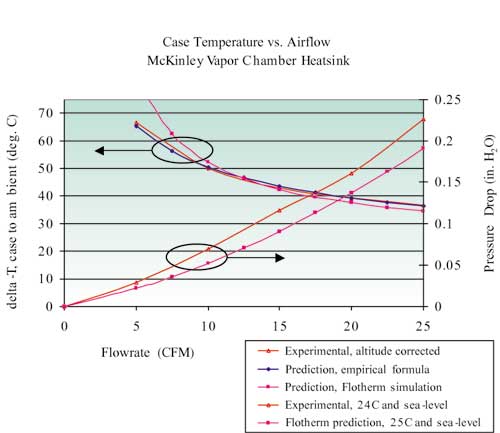 |
Figure 3. Vapor chamber heatsink results.The thermal performance data in Figure 3 shows virtually identical results between the empirically based prediction and experimental data, with all values within 2% – within the accuracy of the available instrumentation. CFD predictions also closely match the available data; from 10-25 CFM, all values agree within 5%. Only at flow rates significantly below 10 CFM does the CFD prediction appear to deviate from the experimental results. Pressure-drop data shows an under-prediction from the CFD model of approximately 18% versus experimental data, when using simulation conditions similar to the laboratory environment.
Integrated Package Heatsink – Processor and VRM
Next, numerical models of the processor, VRM, and integrated heatsink were created with the CFD software. A 44-fin heatsink was constructed from the appropriate module of the software, with base configurations selectable as either vapor chamber, solid copper, or solid aluminum (results only are reported for the aluminum-base heatsink). A VRM model was constructed, with discrete heat sources corresponding to the field effect transistors (FETs) and other power-dissipating components. The processor and TIM characteristics and ambient conditions were identical to those described above.
In addition to baseline cases, simulations were performed with a more conservative assumption for the case-to-pedestal thermal interface, corresponding to a cs of 0.112oC/W, as well as with a lower thermal conductivity heatsink aluminum, K = 180 W/mK. As will be discussed later, this was done in an effort to match more closely the numerical predictions and the results from experimental analysis.As in the preceding case, a processor thermal test vehicle was mounted to the heatsink. It was noted during assembly that the prototype spring retention of the processor/interposer to the heatsink did not maintain appreciable compression of the TIM interface once the TIM-attach procedure was completed; later trials used an improved spring assembly to secure the processor thermal test vehicle. To simulate the thermal load of the VRM, a foil-type heater element, measuring 1/2″ x 1 5/8″ (12.7 mm x 41.3 mm), was affixed to the heatsink base plate. Again, experimental data were altitude-corrected to allow direct comparison with CFD predictions (Figure 4).
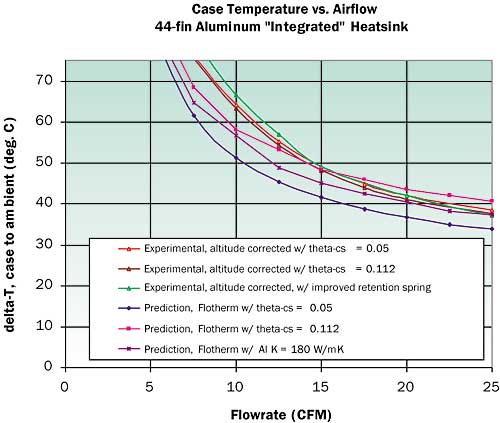 |
Figure 4. Integrated 44-fin aluminum heatsink thermal results.The results of the numerical simulation and the altitude-corrected experimental data in Figure 4 show a similar trend of case temperature versus flow rate; however the simulation under-predicts by some 10-20%. Since there was such close agreement between simulation and experiment for the vapor chamber heatsink, the reason(s) for the mismatch in this case were sought. As mentioned above, simulations with a higher value for cs, corresponding to a degraded case-to-pedestal thermal attachment and achieved by lowering the TIM thermal conductivity, and with lower conductivity aluminum construction were investigated. Note that in the absence of more concrete data, only one parameter was varied at a time, allowing direct comparison to the baseline simulation case. Both of these simulations more closely match the experimental evidence, suggesting that either or both mechanisms may be present. In an effort to improve the case-to-pedestal thermal interface, an improved spring mechanism was used in later trials; however, as shown in Figure 4, test results do not show an appreciable difference from the baseline case.
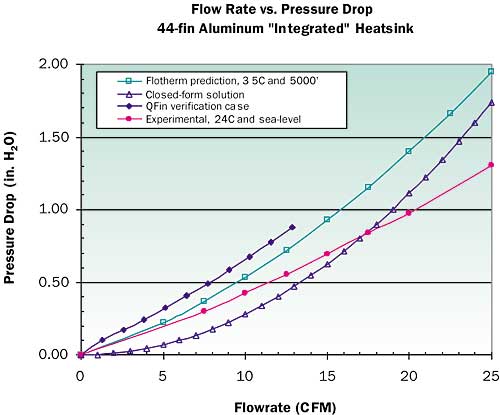 |
Figure 5. Integrated 44-fin aluminum heatsink pressure drop characteristics.Heatsink pressure drop versus flow rate (Figure 5) showed general agreement between simulation and experiment, although this time the CFD program over-predicted the data. In addition to pressure drop data from the simulations, another numerical method was sought [5]. As a final check, further analysis of the same heatsink geometry was performed based on the approach of Ellison [6,7]. Combining formulae for flow entering a perforated or slotted plate, for flow through a card-channel resistance, and for sudden expansion yields the following estimated pressure/flow equation, displayed graphically in Figure 5:
R (in. H2O) = 0.000278 x CFM2 (2)
Based on the above analysis of experimental data, both numerical simulations, and analytical predictions, there seems to be general agreement for pressure drop data.
Heatsink Design Conclusions
The above analysis of case temperature rise versus airflow rate indicates that for a 44-fin aluminum heatsink, the case temperature target is met with between 10-15 CFM; the range is determined by case-to-heatsink interface performance and heatsink thermal conductivity. This corresponds to a peak predicted pressure drop of 0.9 in.H2O at a 15 CFM flow condition. The air mover [8], that is to be discussed in the next section, is targeted for a flow condition of 70 CFM at a system pressure drop of 0.6 in.H2O [1]. Consequently, it is appropriate to consider alternative designs that more closely match predicted heatsink thermal performance and pressure drop to air mover performance. Based on this analysis (Figure 6), it appears that the optimal heatsink design within the constraints of the current system and air mover is with a fin count of approximately 30 fins. The simulations predict that sufficient cooling is still achieved with aluminum construction; for baseline assumptions, simulations predict approximately 13.8 CFM is required at a pressure drop of 0.375 in.H2O. Further simulations showed limited performance gains achievable with copper-base or vapor chamber construction; however, the price and mass tradeoff was not considered worthwhile.
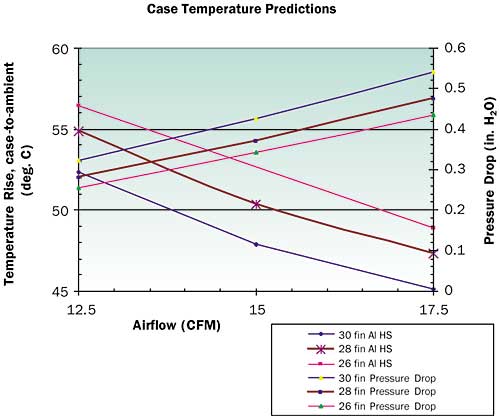 |
Figure 6. Reduced-fin-count heatsink numerical predictions.
Air Mover Selection, Modeling, and Performance
With the extreme space premium in a 1U (1.75″) high, 24″ depth rack-mount system, the cooling options were severely constrained. The air mover solution would have to supply sufficient velocity and volume flow rate for heat transfer to occur, deliver adequate static pressure to drive air through the system, and direct air to the various processor, memory, and I/O components as required based on predicted power dissipation levels.
The pressure drop noted above, 0.38 in.H2O, is across the processor heatsink only; conservatively including chassis inlet and exhaust losses, a total system pressure drop of 0.6 in.H2O was predicted for initial air mover design studies. Total system airflow could then be determined based on the processor requirements and the remaining thermal load. Approximately 15 CFM was required for each processor heatsink, or 30 CFM total, and processor and VRM power combined to account for roughly half of the system power budget of 700 W. For the remaining power dissipation, targeting a 25oF temperature rise yielded a 70 CFM total airflow requirement. In addition, airflow distribution within the chassis must direct 30 CFM through the processor heatsinks, and preferably deliver a high-velocity flow plume along the memory section on the left-hand side of the baseboard.
Air Mover Selection
Current strategies in 1U system cooling for Intel® architecture or RISC servers rely either on numerous commercial off-the-shelf (COTS) axial fans, on small ducted radial impellers, or on a combination of the two. As the shortest dimension in the chassis sets the constraint on axial fan diameter, a 1U system (nominally 1.6″ or 41 mm floor-to-ceiling inside dimension) can only fit a 40 mm axial fan. However, an analysis of expected system pressure drop characteristics indicates that 40 mm fans are not a good match for this cooling scenario. For example, let us consider a fan in a 40 x 40 x 28 mm size [9]; with 15.8 CFM (0.447 m3/min) open flow at 9500 rpm and a shutoff pressure of 0.509 in.H2O, this represents the current state-of-the-art in moderately priced axial fan performance. Even extending this performance envelope through a specific-speed analysis [1], a solution could require as many as 12 fans throughout the system (Figure 7). Thus it is apparent that axial fans are not a viable solution for a 1U system of this power density.
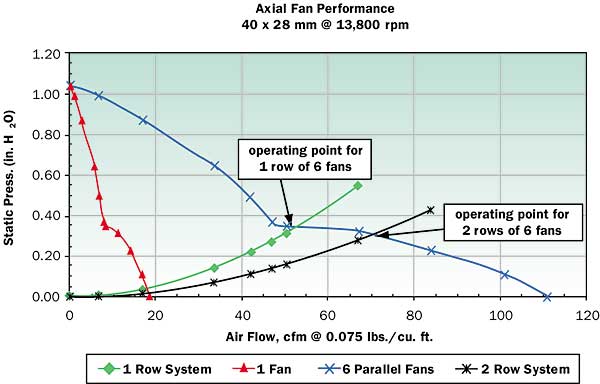 |
Figure 7. Fan performance vs. system operating point.In contrast, ducted impellers allow larger wheel diameters, higher shutoff pressures, lower rotational velocities, and potentially greater flow rates. Therefore, it is possible to consider a cooling strategy that combines axial fans and blowers to achieve the necessary flow, pressure, and distribution characteristics. However, there are reliability concerns with an approach that utilizes multiple fans, as the number of potential failure candidates drastically reduces MTBF. The currently planned service reliability of the cooling system is three years continuous operation at an ambient air temperature of 35oC – at an 80% confidence, no more then 0.25% of cooling systems are to fail during this three year period. While this can be considered only a moderately aggressive target for a single air-mover, meeting this goal with multiple redundant fans makes this a potentially cost-prohibitive option. Further, in a 1U chassis it was considered neither necessary nor practicable to include redundancy of the air management system.
Therefore, the selected cooling architecture is a single radial impeller drawing air from the front of the chassis (Figure 8). A baffle housing around the impeller wheel seals the inlet from the discharge side; ducting and baffle outlet geometry distribute the air as required to the system. After passing over the processors, memory, and chipset components (in parallel paths) the air exhausts through the chassis back panel.
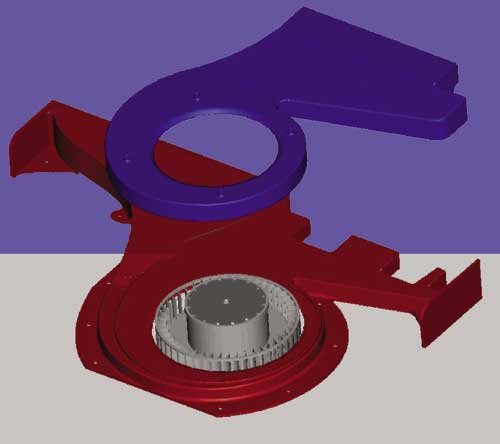 |
Figure 8. Impeller and dual-discharge baffle.Optimization of the radial blower for this specific application involved a careful program of empirically based design, experimental testing, and numerical simulation [8]. Areas addressed included blade design, centerline-axis placement, duct geometry, and inlet plenum height. However, a detailed instruction on numerical and empirical optimization of radial impellers is beyond the scope of this report; the reader is instead directed to textbooks, the research literature, or companies specializing in this area. The following discussion will focus on numerical modeling techniques specific to radial blowers, and aimed at system-level thermal design, analysis, and verification.
Modeling Radial Blowers
There are several methods of modeling a radial blower for use in a CFD simulation, depending largely upon the level of characterization information available (e.g., [10]). One crude method is to duplicate using rectangular fans the radial and swirl characteristics of the impeller, and then to add cuboids to simulate the baffle geometry. The specific implementation, illustrated in Figure 9, is as follows:
- 1. Eight rectangular fans and four collapsed cuboids are arranged in a cruciform fashion inscribing a circle equal in diameter to the blower to be modeled. Four of the fans provide axial flow, 4 fans contribute swirl, and the 4 cuboids complete the geometry.
- Each fan is set with a fan curve equal to 1/8 of the total flow envelope – ideally based on experimental data.
- (Optionally) 4 additional fans can be placed in the model at right angles to the axial fans, to further develop swirl.
- A baffle either is created using cuboids or imported from a mechanical design software package.
 |
Figure 9. Scroll baffle construction and composite fan assembly.A comparison of the flow field generated in the numerical model to that measured experimentally in a populated test system shows general agreement of airflow patterns (Figure 10). Total airflow volumes can be over-predicted if the model’s fan curves are not carefully adjusted to match laboratory measurements.
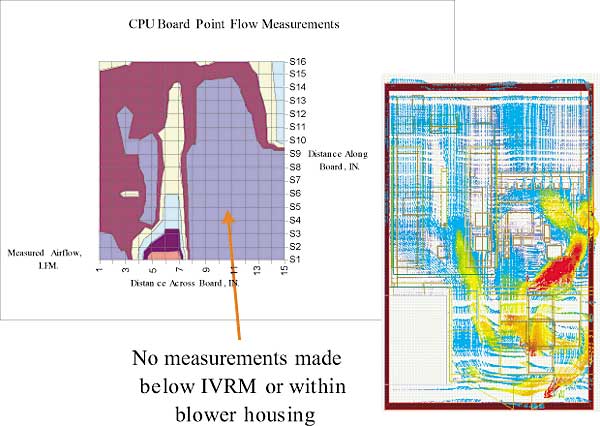 |
Figure 10. Experimental and numerical flow results.
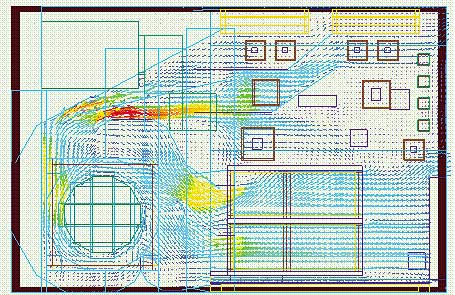 |
Figure 11. Axial fan used to model a radial blower.Another method of modeling radial blowers is to use an axial fan software module with its axis aligned to the rotational axis of the impeller wheel, as shown in Figure 11 and described below:
- 1. Put an axial fan into the model, with the axis aligned to the axis of the impeller under study. A 12-facet fan is preferred since it is more closely circular.
- The inlet side of the fan is aligned with the edge of the solution domain therefore drawing outside air and not including any inlet duct effects, and the thickness (Zo depth) is set to align the fan outlet with the top edge of the fan (i.e., the inlet plane).
- The outer diameter is the same as the real fan, and the hub diameter is pushed out close to that dimension to keep all the flow vectors out near the edge; the distance from the actual impeller central axis to the blades can be used to set this value.
- Fan power is turned on, with a value set from motor current and voltage.
- A cylinder is added below the fan to continue the hub downwards; this keeps the velocity vectors directed outwards so the flow does not cross underneath the fan – otherwise the swirl center will drift away from the fan centerline as distance increases from the outlet plane due to the presence of an outlet baffle/diffuser.
- An inlet resistance is added over the fan to account for the chassis front bezel and EMI screen.
- The fan curve is set based on experimental values for the fan derived in a wind tunnel.
- The swirl value is set so that air velocity vectors leave the fan at about a 45o angle. A V=r
relation can be used to set this number, and iterated as the system flow point is predicted by the model. For example, if flow is leaving the fan at 90 CFM and the fan is 6.625″ in diameter and 0.7″ deep, then the radial velocity is ~560 in/sec. Since the tangential velocity is set equal to this number (so that the exit flow velocity vectors are 45o from normal), the swirl speed is set to ~85 rad/sec. Depending on where the fan is operating (e.g., near open flow or near stagnation), the exit flow angle can be adjusted accordingly.
- A baffle either is created using cuboids or imported from a mechanical design software package.
Advantages of this method include using a single axial fan to model the blower, qualitative reproduction of the outlet characteristics, and reasonable duplication of baffle exhaust velocities. Drawbacks include over-prediction of total flow volumes and misleading airflow properties within the baffle/duct geometry. In fact, it should be noted that neither of the two preceding approaches can successfully recreate the airflow patterns within the complicated geometrical features of the radial blower – a special-purpose software tool would be the preferred approach in that case.
A final method involves intentionally ignoring the inner workings of the radial blower and modeling explicitly only the discharge characteristics. Of course, this presupposes adequate and accurate airflow velocity data at the fan baffle discharge plane, as well as a pressure/flowrate (P-Q) curve for the fan. For a commercially available blower, where the discharge airstream is tightly focused within a cross-section on the order of the height dimension, this should not present enormous difficulties. However, for complex geometries, where focused flow characteristics are not suitable for the thermal management of components widely spaced in the lateral (cross-flow) dimension, such as that shown above in Figure 8, a more deliberate approach is required. In that case, rectangular fans or fixed flow devices are incorporated into the CFD model such that the airflow velocities duplicate laboratory measurements – in essence, the blower is treated as an air velocity “black box.” This method, shown in Figure 12, should be considered the preferred treatment for complex blower geometries and complicated airflow discharge characteristics.
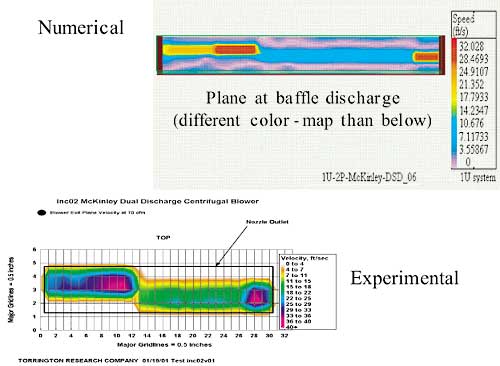 |
Figure 12. Fixed-flow devices duplicating blower discharge properties.
Conclusion
Design challenges for high-power, high-density systems require innovative approaches whenever generic simulation software is utilized. This paper has presented methods of heatsink characterization and radial blower modeling that were developed during the numerical and experimental analysis of a 700 W nameplate 1U concept server. With suitable, and hopefully minor, modifications these methods can be employed in the analysis of other electronics systems.
Acknowledgement
The author wishes to thank Barrett Faneuf, Ven Holalkere, and Stephen Montgomery of Intel, as well as Torrington Research and Incep Technologies, for their collaboration on the research described in this paper.
Editor’s Note: The author was employed by Intel at the time he wrote this article. He is now attending Stanford University where he is earning his Ph.D.
References
- Aldridge, T., B. Fite, V. Holalkere, J. O’Connor, and T. DiBene, “Concept Technologies for High Density Intel® Itanium™ Processor Family Servers”, Intel Developer Forum (IDF), February 2001.
- INCEP Technologies and Intel Advanced Systems Laboratory.
- “FLOTHERM Version 3.1 Release Notes”, Flomerics Limited, 2000.
- Thayer, John, “Analysis of a Heat Pipe Assisted Heatsink”, 9th International FLOTHERM Users Conference, Oct. 2000.
- “QFin Version 2.1 Release Notes”, 2001.
- Ellison, Gordon N., “Thermal Computations for Electronic Equipment”, Robert E. Krieger Publishing Co., FL, 1989.
- Ellison, Gordon N., “Fan Cooled Enclosure Analysis Using a First Order Method”, Electronics Cooling, vol. 1, no. 2, Oct. 1995.
- Lorenzo, D.S., “High-Density Server Design Methodology”, Proceedings of THERMES 2002: Thermal Challenges in Next Generation Electronic Systems, Joshi and Garimella, eds., January 13-16, 2002, pgs. 339-346.
- Delta FUB0412/24VHN, Data sheet for FUB 40x40x28 MM Series Superflo Fans, Delta Electronics 2001.
- S. Shidore and J. Dorsey, “A Proposed Technique for the Modeling of Radial Blowers in FLOTHERM”, Flomerics, Inc.


