Preface
Increasingly it is apparent that measuring the thermal properties of Thermal Interface Materials (TIMs) causes much irritation for vendors and users alike. This article focuses on various measurement and standardization aspects and offers a strategy to overcome the problems. It is essentially an abbreviated version of a paper presented at SEMITHERM ’03 [1].
Introduction
Heat dissipation of semiconductor packages has become one of the limiting factors in miniaturization. The thermal budget consists of three parts: 1) the heat transfer to the outside world to be improved by better heat sinks, higher air velocities and liquid cooling, 2) the thermal resistance of the package itself, and 3) the interface resistance that is defined as the sum of the thermal resistance of the interface material plus both contact resistances.
A recent paper [2] shows that when the TIM that is used for the Pentium 2 is also used for the Pentium 4, its thermal resistance would account for 80% of the allowed total resistance. To enable an optimal choice, the thermal performance of TIMs should be known with a certain accuracy. Measurements are in fact the only choice because no theory exists that predicts the value with the required accuracy despite serious progress in the science of contact resistance.
Problem Areas
It is helpful to make a distinction between problems related to customers and those related to vendors.
Customer-Related Problems
The TIM field is changing rapidly, and many designers are not aware of recent developments. Besides, there is no time to test. This leads to the following consequences:
- Personal preferences based on outdated knowledge.
- Focus on bulk thermal conductivity alone.
- Use of vendor-data without testing in situ.
- Focus on minimum cost of TIM only, leading to sub-optimization.
Vendor-Related Problems
The problems the vendors are facing can be summarized as follows:
- The de facto standard test method (ASTM D5470) generates data that often cannot be reproduced in practice.
- The standard prescribes a pressure of 3 MPa, far above what is used in practice (0.1 MPa).
- Not all vendors use the standard.
- Measurement data are disturbed by unknown differences between test equipment.
- Problems increase with higher thermal conductivity (the future direction) because the influence of the contact resistances becomes larger.
Why the Gap between Customer and Vendor Data?
The gap is caused by several parameters that are application-specific:
- Clip clamping force or screw torque.
- Clip installation.
- Time-dependent phenomena; e.g., reduction in clamping force, warpage, and aging.
- Flatness of both heat sink and component.
- Non-uniform heating.
- Thermocouple placement.
The consequence is usually that a significant difference exists between application-specific and standardized test data. However, the conclusion should not be that, henceforth, the standard test should not be performed. The vendors are responsible for the characterization of their materials. It is the responsibility of the user to address the application-specific issues. However, regarding the usefulness of vendor data, the following important statement can be formulated.
Reliable vendor data should be interpreted as the minimum value a customer can possibly acquire, given a certain pressure.
Problems with the De Facto Standard: ASTM D5470-01
One of the main problems today is the lack of a test method that is agreed upon by everybody involved. Several attempts have been started in the past to arrive at such agreement resulting in a modified ASTM test method (D5470-01). Unfortunately, many vendors are not aware of the problems associated with the technical difficulties of building reliable equipment [2, 3, 4]. Round-robin tests using ASTM D5470 have demonstrated a repeatability error within labs between 10-20%, and a reproducibility error from lab to lab between 20-40% [1]. This is not the accuracy we demand for the future! We need 5% or less for reliability prediction.
Suggestions for Improvement
The following list summarizes some urgent points:
- Awareness rising through independent web sites.
- Development of primary and/or secondary standards.
- Development of application-specific methods.
Bullet point 1 is treated in [1]. Concerning the measurement technique, we have a choice between steady state and time-dependent (dynamic) methods. The main difference between the two is the part that plays a role in the analysis: for dynamic testers, only a small part of the test equipment participates. The advantages of dynamic methods (see also [5]) can be summarized as follows:
- Dynamic methods are inherently more accurate and faster, increasing both repeatability and reproducibility.
- Accurate test facilities are simpler to build.
The main disadvantage is that parameter estimation is more difficult. Ideally, the primary standard should be managed by an independent institution. The secondary standards should be commercially available and calibrated against the primary standard using agreed reference materials.
Possible Primary Standard
Details of the method have been presented in [6,7]. The facility consists of two silver cylinders between which the sample is clamped. The temperature of the lower block can be changed very quickly using water jet impingement. The temperature response of the upper block is a measure for the interface thermal resistance. The main features are:
- High absolute accuracy (better than 5%).
- High relative accuracy (better than 2%).
- High reproducibility and repeatability.
- Virtually frictionless, hence very accurate pressure control.
- Measurement of thickness variations in situ.
Figure 1 shows a photograph of the test set up.
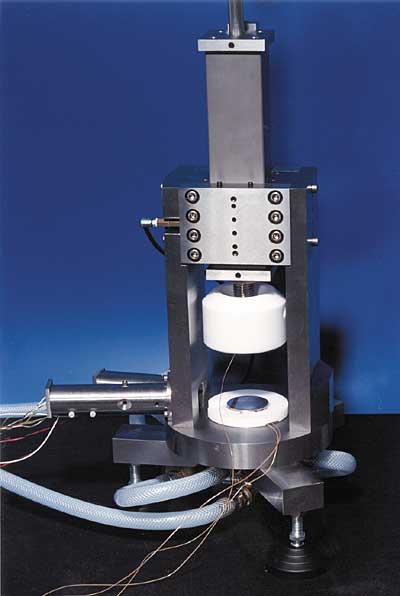 |
Figure 1. Picture of Interface Resistance Tester.Figure 2 shows the total thermal resistance including the contact resistances for a typical soft TIM as a function of pressure. The two curves represent two test sets: from low to high pressure and back. Observe the scale of the y-axis: It runs from 0.606 to 0.618 °C/W. The error bars represent � 0.001 °C/W.
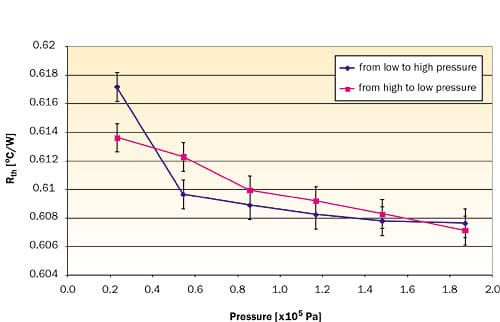 |
Figure 2. Thermal resistance as a function of pressure.Contrary to what is generally stated when discussing the disadvantages of time-dependent methods, the thermal capacity does not enter the equations because of the much larger mass of the rest of the equipment that contributes to the response. Another misunderstanding is that dynamic measurements cannot handle temperature-dependence. It is easily taken care of by increasing stepwise the initial temperature and keeping the temperature-difference constant.
Secondary Standards
Secondary standards differ from primary standards in being much cheaper. Figure 3 shows one of the deliverables of the PROFIT project [8]. At t = 0, the heater is activated and the temperature is monitored at points A and B. A transient tester using special software transforms the response curves into so-called differential structure functions, DSF.
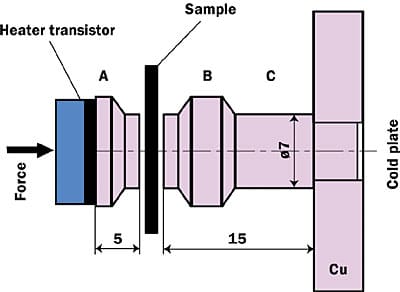 |
Figure 3. A potential secondary standard.Usually two measurements are performed: one without and one with the TIM; e.g., showing the difference between dry contact and grease or an “ideal” contact and a soft TIM (Figure 4). The distance between points A and B in the graph is a measure of the thermal resistance between these two points, including contributions from the copper clamps and the contact resistances. The shift in the position of point B indicates the contribution of the sample only, provided the contact resistances are reproducible (one reviewer suggested the use of a solid copper block for the first measurement).
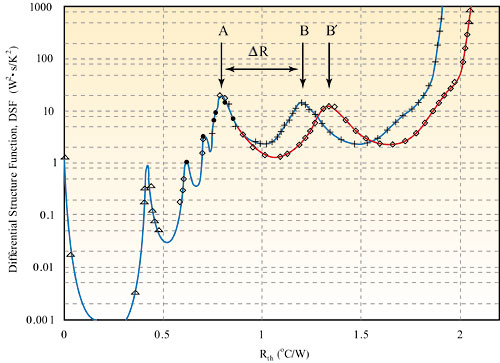 |
Figure 4. Two measurements with and without the TIM.
Application-Specific Test Methods
The proposed standards solve only the problems of the vendors. Users need measurements in situ. Two possibilities are discussed in [1]. The preferred but also more expensive method is highlighted here. A functional package is mounted on a board and provided with the heat sink/interface material to be tested. The whole assembly is fixed inside a wind tunnel and supplied with a transient tester to measure the response to a power step of a suitable p-n junction. Figure 5 is a sketch of the proposed set up.
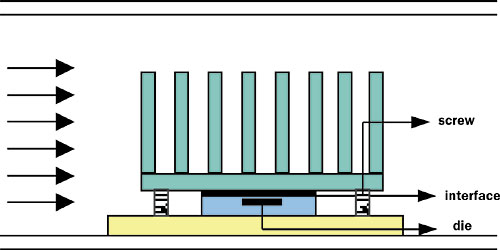 |
Figure 5. Sketch of application-specific measurement.Figure 6 shows results for a certain package/heat sink combination, for four different thermal interface measurements [8]. The difference between dry contact, grease, and mica (for two different pressures) is clearly distinguishable.
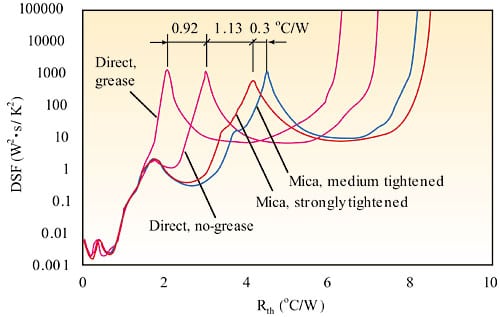 |
Figure 6. Results for various interfaces between a package and a heat sink.
How to Proceed?
While the work leading to ASTM 5470-01 should be highly recognized and implemented as soon as possible, it is also mainly vendor-driven. In a way, we face the same problem as encountered in the field of thermal characterization of packages a decade ago. At that time, no agreed standard existed, and the thermal data published in the data sheets could only be used to compare two different packages, not for system level thermal analyses. Both fields share the large dependence of the measured data on the real application.
Hence, it makes sense to examine if the successful efforts of the JEDEC 15.1 Committee on Thermal Characterization can be transferred to the thermal interface domain. JEDEC 15.1 is considered the world’s leading authority on thermal characterization, offering an independent forum for both vendors and customers. In addition, TIM measurement is already on the roadmap [9]. The main tasks could be:
- Standardization of test methods.
- Choice of reference materials.
- Organization of round-robin tests.
- Definition of nomenclature.
The last issue deserves some discussion. It is important that all people involved use the same terminology. The problem is that some people use the word “thermal impedance”. It should be realized that “thermal impedance” (m2�°C/W) is not the right word to indicate thermal resistance per unit area, because the term is historically reserved to describe time-dependent thermal resistance (°C/W). This will cause a lot of confusion in the future because the use of dynamic test methods will increase. When quoting the performance of a TIM per area, the author proposes to use the universally accepted alternative: the R-value or U-value. Other suggestions are highly welcomed. (Two suggestions are “unit thermal resistance” and “thermal performance”.)
Conclusions
The paper discusses the various problems both vendors and users of interface materials are facing today. The following actions are recommended:
- All customers should start demanding data measured according to an agreed standard.
- All vendors must sign up to ASTM D 5470-01.
- In-house-built equipment should be certified using standardized reference materials.
- Data should only be generated for the range of pressures that reflect practical circumstances.
Recommendations that guarantee a more permanent solution are:
- Discussions should start within the framework of JEDEC 15.1 to result in a standard protocol.
- Commercially available dynamic test equipment should be developed to address application-specific situations.
Acknowledgments
The following persons are acknowledged for sharing their valuable thoughts on the subject at large: Dave Saums, Bob Rauch, Herb Fick and Mike DeSorgo. However, it does not necessarily mean that they agree with all statements put forward in this article.
References
1. Lasance, C., “The Urgent Need for Widely Accepted Test Methods for Thermal Interface Materials”, Proceedings SEMITHERM XIX, March 2003, San Jose, pp.123-128.
2. Gwinn, J., Saini, M., Webb, R., “Apparatus for Accurate Measurement of Interface Resistance of High Performance Thermal Interface Materials”, Proceedings ITHERM 2002, pp. 644-650.
3. Culham, J., Teerstra, O., Savija, I., Yovanovich, M., Design, “Assembly and Commissioning of a Test Apparatus for Characterizing Thermal Interface Materials”, Proceedings ITHERM 2002, pp. 128-134.
4. Kearns, D., “Improving Accuracy and Flexibility of ASTM D 5470 for High Performance Thermal Interface Materials”, Proceedings SEMITHERM XIX, 2003, pp. 129-133.
5. Poppe, A. and Szekely, V., “Dynamic Temperature Measurements”, ElectronicsCooling, Vol. 8, No. 2, 2002, pp. 10-18.
6. Bosch, E. and Lasance, C., “High Accuracy Thermal Interface Measurement of Interface Thermal Resistance”, ElectronicsCooling, Vol. 6, No. 3, 2000, pp. 26-32.
7. Lasance, C., “Dynamic Measurements: a Cornerstone of the European PROFIT Project”, ElectronicsCooling, Vol.8, No.2, 2002 pp. 20-26.
8. Rencz, M., Sz�kely, V., Farkas, G., Courtois, B., “Measuring Interface Thermal Resistance Values by Transient Testing”, Proceedings ITHERM 2002, pp. 136-141.
9. Guenin, B., “Component Thermal Characterization”, ElectronicsCooling, Vol. 7, No. 1, 2001, pp. 36-44.


