In the Tech Data series on thermal conductivity, gases – especially air – have been the subject of a few contributions. So far, the influence of two important parameters has been covered: temperature and pressure. However, people regularly ask: “What exactly is the influence of humidity?” And my standard answer has always been: “Nothing to worry about.”
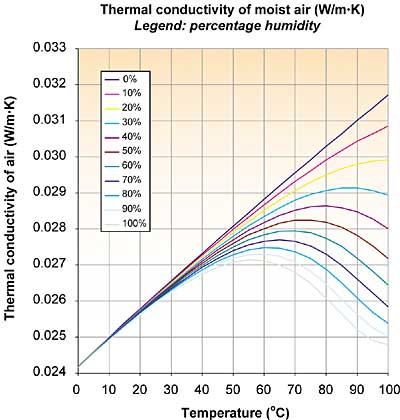
Some time ago, one of my colleagues (Nelis Mies, Philips Lighting) approached me with the same question, and I sent him an old graph proving more or less my standard answer. However, he was not completely satisfied and found software that could create the desired graphs1. The software employs kinetic theory describing a mixture of two gases; in this case, atmospheric air and water vapor. Figure 1 shows some interesting results.

Figure 1. As moisture content increases, the thermal conductivity decreases.
The strange shapes of the curves were rather surprising. With increasing moisture content the thermal conductivity decreases, contrary to what I expected. Three effects play a role: the thermal conductivity of dry air, the thermal conductivity of water vapor, and the humidity of the air. It appears that the thermal conductivity of water vapor is lower than that of air.
An explanation is given by the rigid-sphere theory of gases, stating that the thermal conductivity is proportional to the specific heat (cv) and inversely proportional to the square of the diameter (d) of the molecule. While water vapor has a higher cv than dry air, d is somewhat larger, resulting in a somewhat smaller thermal conductivity at the same temperature (at room temperature: 0.018 vs. 0.025 W/m�K).
With increasing temperature the mole fraction of water vapor increases, as well as the thermal conductivity of dry air. The three effects create the strange shapes. Luckily for me, my standard answer still holds: Nothing to worry about, except when you are after maximum accuracy and all other sources of uncertainty are being addressed at the same time.
1 @Air from Techware


