Introduction
In the past few decades, as microprocessors have continued to evolve along Moore’s law, providing increased functionality and performance, there has been an associated increase in cooling demand driven both by the increase in raw power and in local power densities on the die, commonly referred to as “hot spots”[1, 2]. Considerable attention has therefore been given to the development of thermal solutions and to the characterization of all aspects of the thermal solution. The scope of the development has been constrained significantly by cost pressures and the desire to develop solutions that meet stringent form factor constraints as the marketplace has seen an evolution of form factors increasing the form, fit and function demands on the thermal solutions. In parallel, the relentless pace of microprocessor evolution implies that solution developers must also deal with limited time schedules.
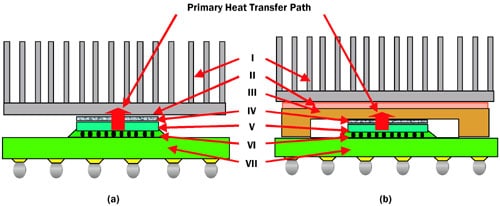
In light of the environmental pressures described above, industrial and academic researchers have partnered well to effectively bring thermal solutions to the marketplace while in parallel systematically investigating the fundamental aspects of thermal solution development. As discussed in [2, 3], a simple classification of thermal solutions may be made into two architectures, schematically illustrated in Figure 1. A key assumption here is that the bulk of the heat transfer occurs through the inactive side of the silicon and that thermal management addresses this primary heat transfer path.
Figure 1. Schematic illustration of the two thermal architectures:
(a) Architecture I is typically used in laptop applications.
(b) Architecture II is typically used in desktop and server applications.
(Legend: I – Heat Sink, II – TIM, III – IHS, IV – TIM, V – Die, VI – Underfill, and VII – Package Substrate)In the first architecture, a heat sink is typically applied directly to the back side of a silicon device through a thermal interface material (TIM). Such architectures are often used in space-constrained applications, such as laptops. The second architecture has a separate heat spreader interfacing directly with the inactive side of the die, and a heat sink interfaces to the heat spreader. In this architecture there are two separate applications of the TIM. It is important to note that in both architectures, the TIM plays a key role in connecting the different aspects of the solution (i.e., the heat source [the die]) with the heat-spreader and/or the heat sink, ensuring efficient transfer of heat. The focus of this article is to discuss the desired characteristics of the TIM, the different classes of TIMs, and their advantages and limitations.
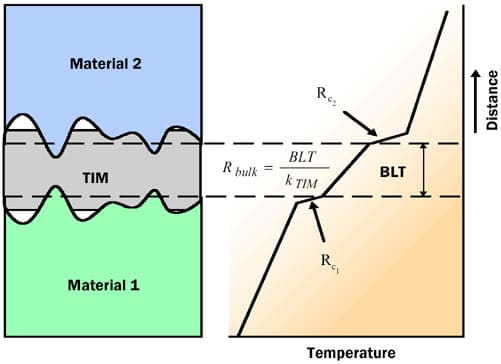 |
Figure 2. Schematic of various resistance components of RTIM.
Desired Characteristics of a TIM
As discussed in the introduction, the TIM acts to connect the different parts of a thermal solution. After inserting a TIM between the solid surfaces, the effective thermal resistance, RTIM, at the interface will have two components, i.e., the bulk resistance, Rbulk, of the TIM arising from its finite thermal conductivity and the contact resistance, Rc between the TIM and the adjoining solids, as shown in Figure 2. RTIM may be expressed as:
where BLT is the bond-line thickness of the TIM, kTIM is the thermal conductivity of the TIM, and Rc1 and Rc2 are the contact resistances of the TIM with the two adjoining surfaces. Note that RTIM, Rc1, and Rc2 are area-normalized thermal resistances (k-m2/W). One of the goals of thermal design is to reduce RTIM. This can be accomplished by reducing the BLT, increasing the thermal conductivity and reducing the contact resistances Rc1 and Rc2. Let us examine in detail how each of these may be accomplished.
Thermal Conductivity
In typical applications [4, 5], the TIM serves to conduct heat through its thickness. The thermal conductivity of a TIM is typically enhanced by loading a soft, sometimes liquid-like polymeric material matrix with conducting solid particles, such as aluminum, alumina and boron nitride. If the design requirement is that the TIM should be thermally conducting but electrically insulating then the ceramic based filler particles are more typically chosen. Figure 3 shows the variation of thermal conductivity of silicone based thermal grease as a function of filler (aluminum) particle volume fraction [6] where km is the thermal conductivity of the silicone oil.
Thermal conductivity of particle laden TIMs can be functionally expressed as:
where kf is the filler thermal conductivity, , filler volume fraction, and Rb is the contact resistance between the fillers and the polymeric matrix. There are various analytical models available in the literature [6]. For spherical particles, one of the most prominent models is the Maxwell model. This model matches the data for spherical particles with
up to 30%-35%, after which percolation phenomenon takes over. Maxwell’s model cannot be used to predict the thermal conductivity for higher volume fraction due to the assumptions built into it. Prasher et al. in [6] used the modified Bruggeman model due its ability to predict thermal conductivity from low to high volume fraction and also because it includes the effect of the interface resistance between the filler and the matrix on the effective thermal conductivity of composites. The modified Bruggeman model for kf/km>>1 is given by:
 |
where is the Biot number and is given as:
where Rb is the interface resistance between the filler and the particle and d is the diameter of the particle. Note that Rb is expressed in units of area-normalized thermal resistance (Km2/W). The solid line in Figure 3 represents the results of the modified Bruggeman model for aluminum filler laden silicon based grease for different values of . Thermal conductivity of silicone was assumed to be 0.2 W/m-K. Figure 3 shows that model matches very well with 40% and 50% volume fraction with
= 0.06 and for 60% volume fraction with
= 0.15. This suggests that interface resistance for 60% sample is higher than 40% and 50% samples. Rb could arise because of imperfect mixing of the particle with the polymer matrix, or due to phonon acoustic mismatch, or due to a combination of the two phenomenon.
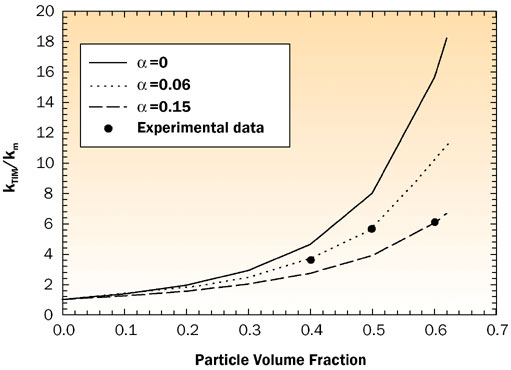 |
Figure 3. Thermal conductivity vs. particle volume fraction for a silicone based thermal grease with aluminum fillers.Prasher et al. [6] have shown that the contribution due to phonon acoustic mismatch at room temperatures or higher is important only when the thermal conductivity of both the materials is very high. In the present case, it is safe to assume the Rb is arising from imperfect wetting or mixing of the filler particles with the silicon oil, as the thermal conductivity of silicon oil is very low. Therefore the phonon acoustic mismatch component is very low at room temperatures. The reason for higher Rb for 60% volume fraction could be due to difficulty in wetting the surface of the particle with the silicone oil as the volume fraction is so high.
Bond-Line Thickness (BLT)
BLT reduction is often another parallel goal of thermal design. BLT is a function of various parameters such as application pressure (i.e., pressure applied in bringing the two contact surfaces together) and particle volume fraction. Prasher et al. [6] have developed an empirical model for the BLT of particle laden polymeric thermal interface materials. They conducted a study on eight different formulations of particle laden polymeric TIMs, which included thermal greases and phase change materials and proposed the following correlation for BLT:
 |
where y is the yield stress of the TIM and P is the applied pressure. This correlation was validated in the pressure range of 25-200 psi application pressures. Figure 4 shows their results. Since the yield stress of the TIM increases with increasing filler loading, BLT is higher for higher volume fraction. Therefore there are two competing effects with regard to filler loading for the thermal resistance of the TIM: kTIM increases and BLT also increases with increasing filler volume fraction at the same pressure, which leads to an optimal filler loading for the minimization of RTIM [6].
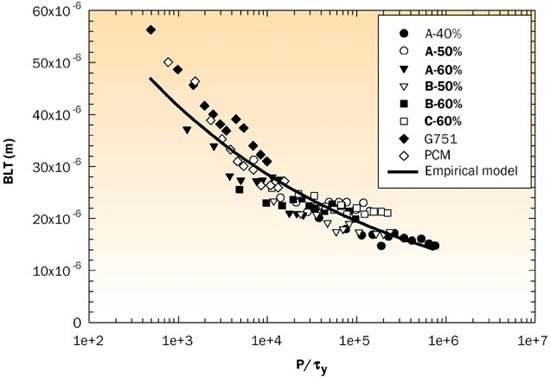 |
Figure 4. BLT vs. P/y for various TIM materials.
 |
Figure 5. Mechanism of heat transfer near the TIM substrate interface.
Contact Resistance
Prasher [8] showed that sum of contact resistance of TIMs with the two adjoining substrates can be written as:
 |
where 1 and
2 are the surface roughness of the substrates, Anominal is the nominal area of heat transfer, and Areal is the real area of heat transfer. As shown in Figure 5, the real area of heat transfer is smaller than the nominal area because of the trapped air in the valleys of a microscopically rough surface of the substrates. In [7] Areal was calculated by performing a force balance due to: 1) applied pressure, 2) capillary force due to the surface tension of the TIM, and 3) back pressure due to the trapped air. Prasher [7] compared the model for phase change and grease type TIMs. Figure 6 shows a comparison between the model and experimental data on phase change material. Based on this, a few general design guidelines were proposed to minimize contact resistance; i.e., (1) increase pressure, (2) decrease surface roughness, (3) increase thermal conductivity of the TIM, and (4) increase capillary force by changing the surface chemistry.
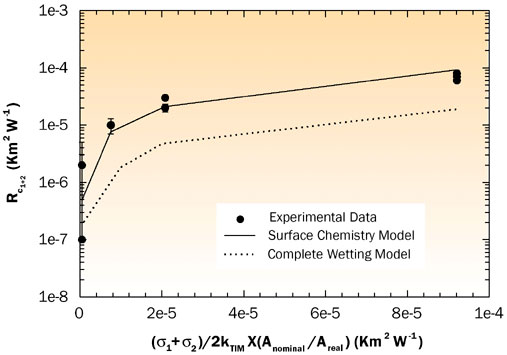 |
Figure 6. Comparison of the surface chemistry model with experimental results for phase change materials.
Reliability of TIMs in temperature cycling
In packages using thermal grease as the conducting medium between the die and the thermal solution, grease pump-out during operation of the part is a known failure mechanism [8]. Traditionally the power cycle test is a direct method to examine grease reliability. However, it is a time consuming process due to its long heating and cooling times. In order to screen numerous thermal grease materials during the initial design phase of a microprocessor package, it is advantageous to utilize a quick turn test.
As described in [8], an accelerated mechanical test was developed to evaluate interface degradation, due to pump-out. An MTS universal testing machine was used to simulate the squeezing action on the grease, caused by die warpage change. Figures 7a and 7b show the typical grease pump-out pattern and temperature trend observed in the quick test, respectively. By using this accelerated testing method, the grease pump-out phenomena can be predicted so that product design time can be significantly reduced.
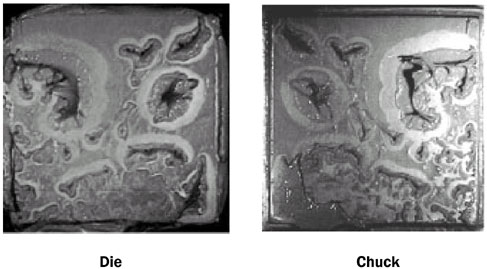 |
Figure 7a. Post-test thermal grease pattern for the case with grease pump-out.
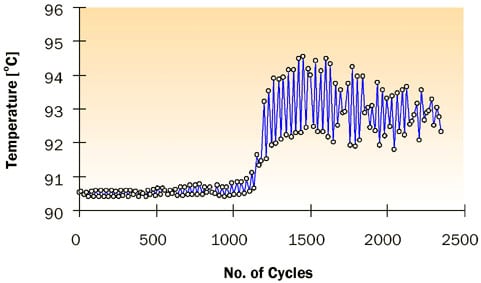 |
Figure 7b. Temperature trend for a case with grease pump-out.To solve the pump-out problem Gel TIMs were recently developed. Gels are also thermal greases but they cure due crosslinking of the polymer at high temperatures. Recently Prasher and Matayabas [9] proposed the following design rules for the formulation of TIMs to avoid pump out problems and also to have a low thermal resistance:
(a) Minimization of G, where G is given by
where G’ and G” are the storage and loss modulus of the polymeric TIM
and
(b) Keep the ratio of G’ and G” greater than or equal to 1. Figure 8 shows the results on the degradation of thermal resistance per cycle from Prasher and Matayabas [9] on eight different samples of thermal greases.
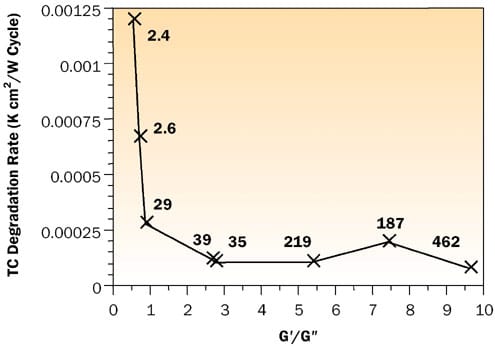 |
Figure 8. Effect of G’/G” on the degradation rate, as measured by thermal performance of gel TIMs subjected to temperature cycling. The labels present the value of G for each sample.The data labels in Figure 8 are the values of G for different samples. So far the discussion has focused on the desired design characteristics of the TIM. These need to characterized experimentally. Over the past few years a number of techniques have been elucidated and the researcher today can rely on the hot and cold plate steady-state method [10], a thermal test vehicle in steady-state test [11], a transient test [12], and sandwich-type samples by the laser flash method [13].
Re-workability
Another typical requirement of TIMs is that of re-workability. Since in a number of applications, the heat sink is attached to the device by the OEM, re-workability is a requirement to avoid yield loss due to heat sink attach. Re-workability implies that the heat sink should be easily removed and that the TIM should be easily cleanable so that the heat sink may be reattached if needed. This requirement has led to certain classes of materials seeing continued popularity; e.g., filled greases, filled phase change materials, and certain gels.
Classes of TIM Materials
Table 1 shows the characteristics of some of the typical TIM materials and their advantages and disadvantages.
Table 1. Summary of Characteristics of Some Typical TIM Materials
|
Summary
In this paper, a general overview of the issues that are important in TIM design and the desired characteristics of TIMs have been presented. It was demonstrated that important attributes of a TIM are its thermal conductivity, and its interactions with the mating surfaces; i.e., the resultant BLT and wetting characteristics. Issues, such as reworkability and reliability, also play important roles in the final selection of the TIM.
References
- Mahajan, R., Nair, R., Wakharkar, V., Swan, J., Tang, J., and Vandentop, G., “Emerging Directions for Packaging Technologies,” Intel Technology Journal, Semiconductor Technology and Manufacturing, Volume 6, Issue 2, 2nd Quarter, 2002, http://developer.intel.com/technology/itj/2002/volume06issue02/index.htm
- Mahajan, R., Brown, K., and Atluri, V., “The Evolution of Microprocessor Packaging,” Intel Journal of Technology, 3rd Quarter, 2000, http://developer.intel.com/technology/itj/q32000.htm
- Atluri, V., Mahajan, R., Patel, P., Mallik, D., Tang, J., Wakharkar, V., Chrysler, G., Chiu, C-P., Choksi, G., Viswanath, R., “Critical Aspects of High-Performance Microprocessor Packaging,” MRS Bulletin, January 2003, Volume 28, No. 1, pp. 21-34.
- Chiu, C-P., Solbreken, G., LeBonheur, V., and Xu Y., “Application of Phase Change Materials in Pentium III and Pentium III Xeon Processor Cartridges,” Proceedings of the International Symposium and Exhibition on Advanced Packaging Materials Processes, Properties and Interfaces, March, 2000, pp. 265-270.
- Chiu Chia-pin, Viswanath Ram, and Solbreken Gary, “Pentium II Processor Packaging-Thermal Management of SRAM’s in SEC Cartridge,” Proceedings of SPIE – The International Society for Optical Engineering, V 3582, November 1998, pp. 833-838.
- Prasher, R., Shipley, J., Prstic, S., Koning, P., and Wang, J-L, “Thermal Resistance of Particle Laden Polymeric Thermal Interface Materials,” Journal of Heat Transfer, Volume 125, December 2003.
- Prasher, R., “Surface Chemistry and Characteristics Based Model for Thermal Contact Resistance of Fluidic Interstitial Thermal Interface Materials,” Journal of Heat Transfer, Volume 123, 2001.
- Chiu, C-P., Chandran, B., Mello, M., and Ken, K., “An Accelerated Reliability Test Method to Predict Thermal Grease Pump-Out in Flip-Chip Applications,” Proceedings of 51th Electronic Components & Technology Conference, Orlando, FL, May/June 2001, pp. 91-97.
- Prasher, R. and Matayabas, J., “Thermal Contact Resistance of Cured Gel Polymeric Thermal Interface Material,” Submitted to IEEE Transactions on Components and Packaging Technology, 2003.
- Aoki, R., and Chiu, C-P., “A Testing Apparatus for Thermal Interface Materials,” Proceedings of 1998 International Symposium on Microelectronics, San Diego, CA, November 1998, pp. 1036 – 1041.
- Solbrekken, G.; Chiu, C-P.; Byers, B.; and Reichenbacher, D., “The Development of a Tool to Predict Package Level Thermal Interface Material Performance,” Thermal and Thermomechanical Phenomena in Electronic Systems – Proceedings of the Intersociety Conference, Las Vegas, Nevada, May 2000, pp. 48-54.
- Chiu, C-P., and Solbrekken, G., “Characterization of Thermal Interface Performance Using Transient Thermal Analysis Technique,” Proceedings of 1999 International Systems Packaging Symposium, San Diego, California, January 1999, pp. 227-232.
- Chiu, C-P., Maveety, J. and Varner, L., “Thermal Conductivity and Resistance Measurements of Three-Layer Composites with Solders,” Proceedings of 2000 International Symposium on Microelectronics, Boston, Massachusetts, September 2000, pp. 846-851.

