Silicon dominates the electronics industry as the semiconductor of choice for most applications, but some electrical functions require electronic properties different from those of silicon. A grouping of semiconductors termed “III-V” have desirable electrical properties for applications such as microwave integrated circuits, light emitting diodes and laser diodes. Some of the desirable electrical properties include higher breakdown voltage, higher saturated electron velocity, higher electron mobility and lower noise generation.
The term III-V refers to the column position of the constituent elements in the periodic table. Several numbering schemes exist for labeling the periodic groups (columns), but the III-V semiconductors group name has its origin in the style of the Chemical Abstract Service numbering scheme and is unlikely to change even if conventions of numbering the period columns sequentially from left to right are adopted. The first four elements in the III column are Nitrogen (N), Phosphorus (P), Arsenic (As), and Antimony (Sb). The first four elements in the V column are Boron (B), Aluminum (Al), Gallium (Ga), and Indium (In). Note that Silicon (Si) is in column IV.
|
Table 1. Thermal Conductivity of Selected III-V SemiconductorsTwo of the most common III-V semiconductors are Gallium Arsenide (GaAs) and Indium Phosphide (InP). Table 1 lists typical values of the thermal conductivity for GaAs and InP, as well as three other III-V semiconductors that are in various stages of maturity. Since this list is incomplete (and evolving), Reference [1] provides a good starting point for the interested reader. Reported values of thermal conductivity for these materials have significant variation in published literature. Besides measurement errors, some of the variation in the reported values results from the difficulty in preparing pure samples of these compound semiconductors and the fact that the measurement temperature is not always reported.
 |
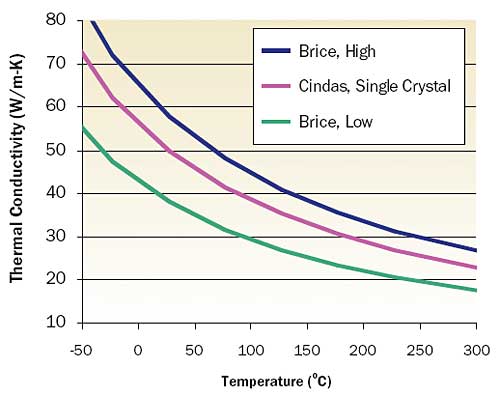
Figure 1. Thermal conductivity of GaAs as a function of temperature.Since GaAs is the most established compound semiconductor, multiple literature citations for thermal conductivity exist and it is instructive to illustrate the variation in a graphical form. Figure 1 plots thermal conductivity with both high and low values, as reported by Brice [2] as a function of temperature. The high and low curves bound most of the available measurements and the high curve is about 50 percent greater in value than the low curve. The center curve illustrates values reported by the Center for Information and Numerical Data Analysis and Synthesis [3] (CINDAS) at Purdue University and represents a reasonable average value. A curve-fit to the CINDAS data that reproduces the data within 3% in the range of -50 to +300°C is:
where the temperature (T) is in K and the conductivity (k) is in W/m-K.
References
- http://www.onr.navy.mil/sci_tech/information/312_electronics/ncsr
- Brice, J.C, Thermal Conductivity of GaAs, EMIS Data Review RN15275, October 1985.
- SRC/CINDAS Microelectronics Material Database, Update #14, September 1995.


