Introduction
Numerous thermal management techniques exist depending on the system, application, and power level. For airborne electronic systems, the most direct approach to thermal management would be to use ambient air or chilled air, provided by the aircraft, routed to and blown across the electronics. However, in some applications potential contaminants in the cooling air, such as moisture, dust, and particles, must be isolated from the electronics. In these cases, an indirect approach is used with the cooling air routed through coldwalls. Heat dissipated on the PWBs is conducted to the card edge, which is clamped to the coldwall.
In cases of new aircraft designs, the electronic dissipations of all of the electronic systems to be used on the aircraft are contemplated during the design of the aircraft ECS. For electronic equipment, which is air-cooled by a fan, the variation of flight altitudes results in variable air densities, which become quite low at the higher altitudes. For constant speed and, thus, constant volume systems operating at altitudes up to 13.7 km (45,000 ft), the low air density will result in decreasing mass flow rates at increasing altitude.
The purpose of this article is to describe the coldwall design process to account for variations in the mass flow of air through a coldwall as the altitude, and density, varies [1-3].
Nomenclature
Abbreviations:
ECS = environmental control system
Hz = frequency (cycles per second)
PWB = printed wiring board
STP = standard temperature and pressure
Variables:
d = pin base diameter, [m]
f = Fanning friction factor based on d, where
f = d Δp / 2 ρ V2max l
L = pin length, [m]
= mass flow rate, [kg/s]
p = static pressure, [kPa]
Q = volume flow rate, [m3/s]
Red = Reynolds number based on d, Eq. (11)
S = streamwise pin row-to-row distance, [m]
T = transverse pin center-to-center distance, [m]
t = wall thickness (of heated wall), [K]
Vmax = velocity at the minimum frontal area of a pin row, [m/s]
Pin Fin Configuration Parameters:
L/d = dimensionless pin length
S/d = streamwise direction dimensionless pin spacing
T/d = transverse direction dimensionless pin spacing
Greek Symbols:
Δp = pressure drop, [Pa]
ρ = air density, [kg/m3]
σ = ρ/ρo, ratio of the density of air at altitude to the density of air at STP
Keywords
Air-cooling, pin fin coldwalls, fan-supplied cooling-air, high-altitude operating conditions.
 |
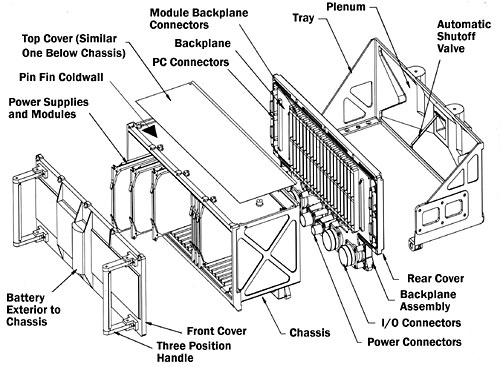
Figure 1. Exploded view of air-cooled computer chassis showing inlet air plenum, PWB card ribs, and pin fin coldwalls.
Description of Computer Chassis
To illustrate the design considerations of a fan-cooled system operating at various altitudes, consider a cast computer chassis, which slides into an aircraft rack. An exploded view of the chassis is shown in Figure 1. Slots exist for 24 modules. These electronic boards are edge-cooled by two cast, pin fin coldwalls on the top and bottom of the chassis. At low to moderate Reynolds numbers, typical for fan-cooled systems, superior performance can be achieved using pin fins [4, 5]. The boards are inserted into their respective slots and plugged into a back plane.
 |
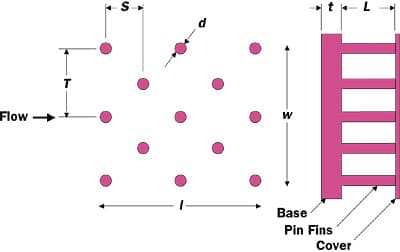
Figure 2. Drawing of pin fin coldwall configuration indicating pin height and pin spacings.
Cooling air is drawn through the two coldwalls from left (front) to right (back) and exhausted through a port in the plenum. The chassis slots and the PWB card edges are aligned with the flow direction of the air in the coldwalls. The coldwalls are integral to the cast aluminum chassis. For the cast aluminum coldwalls, pin fins were considered to be the most suitable. The configuration of the pin fins is described in Figure 2.
Thermal Design Overview
Overall, the design process consists of defining the coldwall configuration, predicting the system curve, namely, the pressure drop vs. flow rate, selecting an appropriate fan, verifying the performance over the range of operating altitudes, with emphasis on the nominal and most critical altitudes. Once satisfactory hydrodynamic performance is achieved, predict the coldwall thermal performance at the fan operating point. If necessary, iterate the design. The coldwall results are coupled to the PWB thermal design in that the dissipations from the PWBs establish the thermal boundary condition for the chassis. The resulting chassis rib temperatures are then used as the boundary condition for each PWB thermal design.
Chassis Hydrodynamic Design
The key step in designing a pin fin coldwall is to predict and maximize the pressure drop through the coldwall. Correlations exist for the pressure drop in terms of the Fanning friction factor, f, as a function of the Reynolds number for a range of pin heights, pin diameters, and streamwise and transverse pin spacing configurations using air as the fluid [6]. The Fanning friction factor, as defined in the nomenclature, relates the static pressure drop to the dynamic pressure and the channel geometry. Changes in the mass flow significantly affect the coldwall pressure drop. Hence, the performance must be examined over potential operating altitude variations. Once the pin fin configuration is established for satisfactory hydrodynamic performance, the heat transfer performance is verified [7]. Pin fin coldwall design examples, using these correlations, are described in detail elsewhere [8].
For the computer chassis described above, a duct mounted fan draws air through the coldwalls. With the knowledge that a pin fin coldwall design would result in moderate to large pressure drops at the flow rates required, several fans were evaluated for suitable pressure drop characteristics as a function of mass flow rate. An axial, mixed flow, 400 Hz fan with a high-static-pressure/high-volume-flow characteristic curve was selected for this application [9].
The fan characteristic performance curve, provided by the manufacturer, was plotted as the static pressure, p, developed by the fan as a function of mass flow rate. The mass flow rates were measured at conditions of 101.35 kPa (14.7 psia) and 15�C (59�F), where the density of air is 0.001237 g/cm3 (0.0772 lbm/ft3). These are STP conditions, so that the ratio of the actual air density to the air density at STP, σ, is equal to unity. The volume flow rate, Q, at STP conditions was calculated using
This calculated volume flow rate was then used to calculate the mass flow rate at the sea level pressure of 101.35 kPa (14.7 psia) at the temperature of 55�C (131�F), the sea level operating temperature for this military environment, by using the relationship:
For the sea level condition, the density of air is 0.001089 g/cm3 (0.068 lbm/ft3) and the value of the density ratio compared to STP is σ = 0.881.
 |
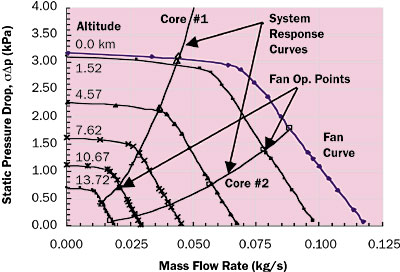
Figure 3. System response curves for two candidate pin fin coldwall cores superimposed on fan performance curves showing fan operating points as a function of altitude.
Since the volume flow rate is constant over altitude for this fan, the mass flow rates at other altitudes and temperatures may be calculated using appropriate values of σ for that altitude and temperature. In order to create a new fan performance curve for the higher altitude conditions, the static pressure developed by the fan at STP conditions must also be multiplied by the appropriate value of σ for the higher altitudes [1]. The performance curves for this fan, created for six altitudes from sea level operating conditions to operating conditions at 13.72 km (45,000 ft), are shown in Figure 3. The fan performance curves show that the static pressure developed by the fan is a maximum at a mass flow rate of zero. As the load on the fan (mass flow rate) increases, the static pressure developed by the fan decreases to zero at the maximum, or no-load, flow rate.
Table 1. Dimensions of Coldwall Cores Selected for Analysis
|
||||||||||||||||||||||||||||||||
Using the pin fin correlations, a system response curve was developed by analyzing two pin fin coldwall candidate designs, designated as Core #1 and Core #2. In each case, the flow length of the cold wall is 152.4 mm (6.0″) and the flow width is 406.4 mm (16.0″). The dimensions of these candidate cores are shown in Table 1, which gives the pin length, L, the pin diameter, d, the streamwise spacing, S, and the transverse spacing, T, of the pins.
The system response curves for these two coldwall designs were plotted as the static pressure drop through the system, σΔp, as a function of the mass flow rate flowing through the system. The system response curves were, then, superimposed on the altitude performance curves for the selected fan.
In order to obtain the actual mass flow rates developed by the fan-system combination, the operating point of the fan is determined at the intersection of the fan curve and the system curve. As may be seen in Figure 3, this operating point varies with altitude indicating that the mass flow rate developed in the coldwall decreases with increasing altitude.
Also in Figure 3, the system response curve for Core #1 crosses the fan curves in the flat portion of the fan curve, where large changes in mass flow rate occur with small changes in static pressure, indicating that the fan efficiency in this region is not good. A better operating system and higher flow rates would result if Core #2 were used, since the intersection of the fan curve and the system curve is on the down-slope of the fan curve. Hence, Core #2 was selected for further evaluation.
Chassis Thermal Design Summary
A numerical thermal model was developed for the chassis in order to predict chassis rib temperatures to be used as future boundary conditions for thermal analyses of the modules. For this numerical model, the PWB power dissipations, totaling 400 W, were imposed by slot as heat sources and the inlet air temperature and the heat transfer coefficients from the pin fin evaluations were used as convective boundary conditions to the model.
 |
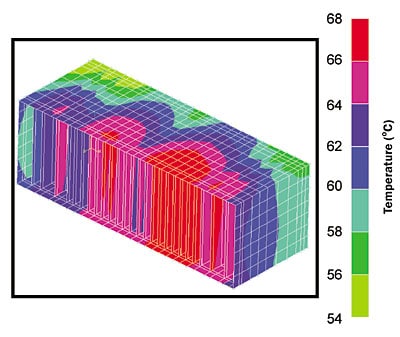
Figure 4. Color contour plot from finite volume model of computer chassis using pin fin Core #2 evaluated at sea level .
Evaluation of the chassis thermal model provides different results for each flight altitude (each mass flow rate). The results, shown in the temperature contour plot of Figure 4, represent the chassis temperatures for a sea level flight altitude. There would be a similar model evaluation for each of the other five flight altitudes.
The temperature distributions along the card edge for each PWB were established using the chassis model. Since the flow of air is parallel to the PWB card edge, a variable coldwall slot temperature resulted. The final step in the overall process is to predict component junction temperatures on each PWB. The edge boundary condition for the PWB analysis is the chassis rib temperature, described here, plus the edge contact resistance. The chassis and PWB thermal design is further described in Price and Short [3].
Summary
The computer chassis, the subject of this paper, is described in detail, with respect to the hardware and the thermal design of the pin fin coldwalls. The fan selection is discussed and the fan operating points are selected. The mass flow rates of air generated by the fan as a function of altitude are calculated and the pin fin coldwalls are evaluated for coldwall temperatures and airside heat transfer coefficients calculated. These parameters are used to develop a thermal model of the chassis.
References
- Gebert, G., “How Altitude Affects Forced Air Cooling Requirements of Electronic Equipment,” AMETEK Rotron, Mil-Aero Products, 9 Hasbrouck Lane, Woodstock, NY 12498, http://www.rotron.com
- Marthinuss, J. and Hall, G., “Cooling Electronics at High Altitudes Made Easy,” ElectronicsCooling, Vol. 3, No. 4, September 1998.
- Price, D. and Short, B., “Thermal Design of an Airborne Computer Chassis with Air-Cooled, Cast Pin Fin Coldwalls”, ASME Journal of Heat Transfer, Vol. 127, January, 2005, pp. 11-17.
- Norris, R. and Spofford, W., “High-Performance Fins for Heat Transfer,” Transactions of the American Society of Mechanical Engineers, Vol. 64, 1942, pp. 489-496.
- Kays, W., “Pin-Fin Heat Exchanger Surfaces,” Dept. of Mechanical Engineering, TR 19, Stanford Univ., Stanford, CA, August 1953.
- Short, B., Raad, P., and Price, D., “Performance of Pin Fin Cast Aluminum Coldwalls: Part 1 -Friction Factor Correlations,” AIAA Journal of Thermophysics and Heat Transfer, Vol. 16, No. 3, July-September, 2002, pp. 389-396.
- Short, B., Raad, P., and Price, D., “Performance of Pin Fin Cast Aluminum Coldwalls: Part 2 – Friction Factor Correlations,” AIAA Journal of Thermophysics and Heat Transfer, Vol. 16, No. 3, July-September, 2002, pp. 397-403.
- Short, B., Price, D., and Raad, P., “Design of Cast Pin Fin Coldwalls for Air-Cooled Electronic Systems,” ASME Journal of Electronics Packaging, Vol. 126, March 2004, pp. 67-73.
- Howden Group Limited, Old Govan Road, Renfrew, Renfrewshire, PA4 8XJ, United Kingdom, Telephone: +44 141 885 7300, Web Site URL: http://www.howden.com


