Introduction
In the past, thermal engineers were content to calculate a single junction temperature in the thermal characterization of an integrated circuit chip in a package. In recent years, as power levels have increased, more attention has been paid to the calculation of local temperature variations on a chip. This is necessary to adequately account for high-heat-flux regions of the chip, often called “hot spots.” This Calculation Corner extends the use of techniques explored in previous installments to perform these calculations very quickly and with reasonable accuracy.
Radial Thin Fin Model
In previous columns, the radial thin fin (RTF) model has been used successfully to calculate the thermal resistance of a heat spreader or circuit board surrounding a single centrally-located heat source or sink [1, 2, 3]. An alternative and algebraically simpler method is found in [4]. In this article, analytical expressions are used to calculate the temperature of a square plate, both in the region under the heat source as well as the surrounding area [5].
The RTF model does an excellent job of calculating in-plane thermal gradients in a plate, resulting from heat spreading. However, it neglects through-thickness thermal gradients. This will be a source of error that should be considered. However, it is used in these calculations because of its relative simplicity and because it can readily provide the local temperature in any region of a plate due to an arbitrarily located heat source.
The RTF model can, of course, represent a fin cooled by convection and radiation assuming a constant ambient temperature. However, it can also deal with a mathematically equivalent situation of a plate which conducts heat through a lower conductivity layer to an isothermal surface [1]. The situation envisioned here would be a heat source on a silicon chip attached to an isothermal surface using a thermal interface material (TIM). The power map on an IC typically consists of rectangular regions of different heat flux, each representing a different functional block on the chip.
Single Heat Source
As its name implies, the RTF model applies only to situations with circular symmetry. Hence, the first step in using it would be to circularize a rectangular heat source.
The principle applied here is that the circularized heat source should have the same area as the original rectangular source. Accordingly,
where a is the radius of the transformed source.
The next step is to calculate the value of an effective heat transfer coefficient due to heat flow through the TIM using the following equation:
 |
The following equations can be used to calculate the temperature everywhere in a circular plate with a centrally located heat source,
 |
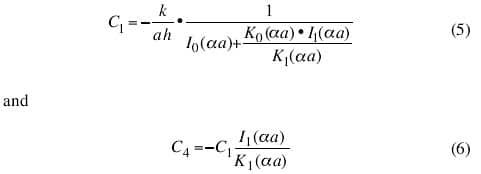
in which the constants C1 and C2 are calculated from
 |
where: P is the power dissipated at the source; k and t are the thermal conductivity and thickness of the plate, respectively; r is the radial distance from the location of interest to the center of the source; T0 is the temperature of the isothermal surface; α = (h/kt)1/2 ; and I0 and I1 are modified Bessel functions of the 1st kind, K0 and K1 are modified Bessel functions of the 2nd kind, and the subscripts, 0 and 1, indicate the order.
Note, in Eqn. 4, the far-field term, proportional to I0(α r), has been dropped. This is due to the fact that in the physical situation explored, the temperature field drops off rapidly with distance from the edge of the heat source. Additionally, this fact permits the use of the above equations in calculating the temperature field of a source not located at the geometrical center of the plate. This is critical to our use of these equations in a power map calculation.
Multiple Heat Sources
It is a relatively simple matter to calculate the temperature map for a number of heat sources. Using the principle of superposition, one need only calculate the temperature rise at a given x,y location for each heat source considered separately, and, then, take the sum of all the individual temperature rises [6]. To do this, one need only calculate the radial distance from a particular x,y location to each source and plug it into equations 3-6 along with the specific values of a and P characterizing the source. In contrast, k, h, t, and α can be considered global parameters that are used in the calculations for all the heat sources.
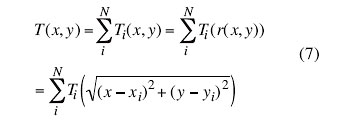
This process is captured by the following equation
 |
in which Ti and xi and yi represent the temperature and the location of source #i, respectively.
Image Sources
When a source is sufficiently close to an edge or a corner of the plate, the heat flow path is truncated. Equations 3-6 do not account directly for these boundary effects. However, by including image sources that are symmetrically located across the boundary with respect to the real sources, the boundary effects can be readily accounted for. The image sources should have the same size and power as the real source [7].
Solved Examples
The above techniques are used to calculate the temperature distribution in a 20 mm square silicon chip for various heat source configurations.
Table 1 lists the dimensions and properties assumed for the physical components in this example.
Table 1. Dimensions and Properties of Physical Components in Examples
|
||||||||||||||||||||||||||||||||||||
The analytical method discussed above was applied to this problem using a spreadsheet having a fairly elaborate construction. Details of its construction are presented below. This problem was also solved using a commercial finite element analysis tool [8]. The accuracy of the analytical method was determined by comparison with the FEA results.
Example 1
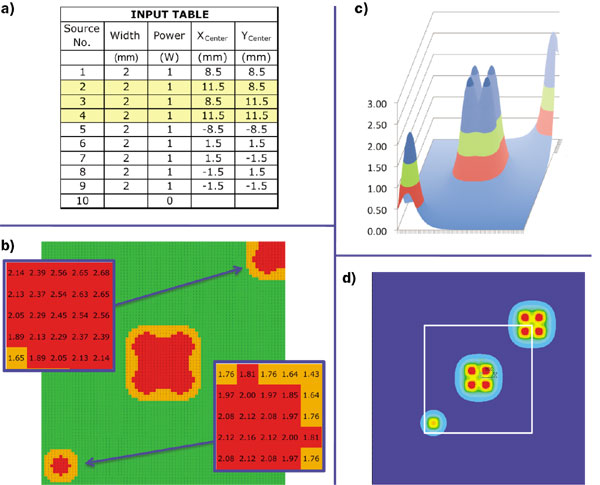
The table in the spreadsheet in which the parameters specific to each source are input is depicted in Figure 1a. A total of nine sources are listed. Of them, five are real sources and are located within the chip area. Four of them (highlighted in yellow) are image sources which create the same boundary conditions for source #1 as a physical corner.
 |
Figure 1. a) Input table used in spreadsheet. Image sources are highlighted. b) Output table of calculated temperatures in spreadsheet with temperature-dependent color coding. c) 3D plot of temperature array in output table. d) FEA calculation of temperature contours of chip using image sources. White rectangle represents lateral dimensions of 20 mm sq. chip.
The spreadsheet is constructed so that each of the ten possible heat sources has its own dedicated sheet for calculating its own temperature field over the entire chip area. Each of these sheets is linked to the appropriate parameters in the input table for its assigned source and also to the global input parameters.
Figure 1b depicts a table in the spreadsheet containing the calculated temperatures for the entire chip. It contains an 80 x 80 matrix of calculated temperatures. With a 20 mm square die, a temperature is sampled at intervals of 0.25 mm. Each cell in the table represents a summation of the temperatures in the same row-column location on all the source-specific sheets. The insets zoom in on selected regions of the matrix to show the temperatures calculated for two of the sources.
The temperature-dependent color coding is accomplished by using the “conditional formatting” capability of the spreadsheet.
One should note that source #5 located at the lower left corner of the table does not have image sources included in the model. Hence, its temperature distribution is the same as it would have been had it been far away from the corner.
Sources 6 � 9, located near the center of the chip, are in the same relative position as source #1 and its off-chip image sources. Note that each quadrant of this 4-source array has the same temperature contours as source #1.
Figure 1c contains a 3D plot of the temperature distribution as generated by the spreadsheet. It illustrates the complex temperature field represented by the superposition of the temperature distributions from all the sources. It clearly illustrates that, due to the interaction with its image sources, the peak temperature at source #1 is: 1) greater than that at source #5, and 2) equal to that of the centrally located sources.
Figure 1d shows a temperature contour plot as calculated by FEA for the same situation as the analytical calculation. The white square in the middle of the plot represents the physical boundaries of the chip. One notes that the temperature contours within the chip outline show the same overall distribution as the analytical calculation due to the explicit inclusion of the same image sources in the model. Since there are no image sources near source #5, its temperature distribution differs from the one that would have been obtained had the lateral dimensions of the model corresponded to the actual chip dimensions.
Example 2
In this example the temperature distribution along a 1-dimensional path is calculated as a 2 mm x 2 mm source is successively relocated from the center of the chip toward either the edge of the chip or the chip corner. FEA is used to calculate the temperature distribution at both the top and bottom surfaces of the chip. In all cases, the appropriate image sources were present in the analytical model.
 |
Figure 2. Temperature distribution along a 1-dimensional path calculated for square source successively relocated along the path: along x-axis from center to edge and b) along diagonal from center to corner. Upper and lower curves represent FEA calculations for top and bottom chip surfaces. Dotted curve represents the analytical model results.
Figures 2a and 2b contain graphs of temperature distributions along the x-axis and chip diagonal, respectively. One notes that the temperature distribution calculated at each location by both methods have the same lateral extent. Also, the peak temperature at each location calculated from the analytical method is between the temperatures calculated by FEA for the top and bottom surfaces. In general, the analytical result is 23% lower than the FEA value for the top surface and 13% higher than the value for the bottom surface. The analytical method clearly demonstrates an increase in the temperature for a source located near a corner or an edge of the same magnitude as that in the FEA model.
The error in the analytical calculation will be smaller in situations in which the ratio of the temperature difference in the chip to the total temperature difference is smaller. Reductions in either the chip thickness or in the value of hEff associated with the TIM tend to reduce the error.
A quick estimate of the error in the analytical model can be obtained by taking the ratio of the thermal resistance for the chip alone to the combined thermal resistance for the chip plus that for the TIM, assuming 1-dimensional heat flow:
 |
Applying this formula to the current situation yields an estimated error of 18%, which is comparable to the actual error reported above. It is recommended that the error be estimated in this manner when using the analytical method described here. In fact, in critical situations, the estimated error could be used to make a first-order correction to the calculated peak temperature values using the following expression:
 |
Applying this simple correction to the current results would reduce the error to around 6%.
Example 3
A third study was performed on the representation of rectangular heat sources by the analytical method. It was found that when a rectangular heat source is represented by a coarse array of appropriately-sized square sources, the temperature contours were accurately accounted for. The error in calculating the peak temperature was similar to that for the square sources.
Conclusions
An analytical method was demonstrated for the calculation of temperature distributions for a silicon chip with an arbitrary power map. The method captured well the lateral distribution and relative magnitude of the resultant hot spots. In the examples evaluated, the error in calculating peak temperatures was on the order of 20% and on the low side. The error would be reduced for situations with thinner chips and/or higher thermal resistance TIMs. A method for estimating the error was demonstrated. In critical cases it can be used to make a first-order correction to the peak temperature calculation. In the present examples, its use would reduce the error to around 6%.
References
- Guenin, B., “Heat Spreading Calculations Using Thermal Circuit Elements,” ElectronicsCooling, Vol. 14, No. 3, August, 2008.
- Guenin, B., “Convection and Radiation Heat Loss from a Printed Circuit Board,” ElectronicsCooling, Vol. 4, No. 3, September, 1998.
- Guenin, B., “Thermal Vias � A Packaging Engineer’s Best Friend,” ElectronicsCooling, Vol. 10, No. 3, August, 2004.
- Lasance, C., “Heat Spreading: Not a Trivial Problem,” ElectronicsCooling, Vol. 13, No. 3, August, 2008
- Lall, B., Ortega, A., and Kabir, H., “Thermal Design Rules for Electronic Components on Conducting Boards in Passively Cooled Enclosures,” Proceedings, Fourth InterSociety Conference on Thermal Phenomena in Electronic Systems (iTherm), May, 1994, pp. 50-61.
- Guenin, B., “Device Temperature Prediction in Multi-Chip Packages,” ElectronicsCooling, Vol. 12, No. 3, August, 2006.
- Mart�n H�riz, V., et al., “Method of Images for the Fast Calculation of Temperature Distributions in Packaged VLSI Chips,” Proceedings, THERMINIC Conference, Budapest, September, 2007, pp. 18-25
- ANSYS™, Version 11.0.


