Introduction
For the consumer, natural convection cooling or fan-less cooling is the method of choice. It is silent, it is reliable, it is simple, and it is environmentally sound because no additional energy is used to remove the excess heat. For the thermal engineer, fan-less cooling is more problematic. On the plus side, no fan is needed, so there is an attractive cost benefit. On the minus side, natural convection cooling is more complicated to design in because it is too difficult to judge if a certain application is suitable for fan-less cooling at the beginning of the design process. The better box model was developed to help this assessment.
The Simple Box Model
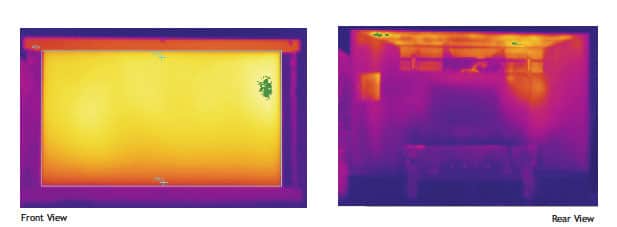
Figure 1 shows an IR picture of an LCD TV. The walls of the TV are above ambient temperature, so the walls transfer heat to the ambient. Cool air enters at the inlet vents at the bottom, and hot air exits at the top outlet vents causing a vertical temperature gradient that is visible at the back side of the set. These observations form the basis of the so-called “simple box” model. In this model, the product is seen as a heat source q inside a box. A linear temperature gradient of the air inside the box, from ambient temperature T0 at the bottom to T1 at the top of the box, is assumed. It is also assumed that the heat transfer from the source through the wall of the box can be described through an effective heat transfer coefficient heff. Furthermore, we assume that an air flow Φ m3/s enters the box at ambient temperature T0 and exits the box at T1. This all leads to the following equations:
Where Abox is the surface area of the box and ρ, cp, are the specific mass and specific heat of air. Solving for the temperature difference over the box, we get:
Figure 1. An infrared picture of an LCD TV.
The Better Box Model
With the simple box model the air temperature rise over the box can be estimated once we know how much air flows through the box. The problem in natural convection cooling is that this air flow is not known a priori: The flow is determined by the balance between the driving pressure and the pressure drops from viscous and dynamic flow resistances, but in natural convection cooling, the driving pressure is due to buoyancy, which is dependant on the temperature rise that we wanted to know in the first place.
So, what does the buoyancy pressure look like? Again, let’s assume that we have a box with cross-sectional area Acs and linear air temperature distribution over the height, T0 = Tambient at the bottom of the box at x = 0, and T1 at the top of the box at x = L. We look at the force balance of a slice of air taken from the box at location x, and with thickness dx. The slice of air has a downwards force due to its weight, ρ(x)g ·Acs dx, and an upward force resulting from Archimedes’ buoyancy law, ρ0g·Acs dx. After integration over the length of the box, using the ideal gas law Δρ/ρ = ΔT/T (T in Kelvin,) we find the buoyancy pressure over the box1
The driving pressure is balanced by the pressure drop over the viscous and dynamic flow resistances. The viscous pressure drop is related to viscous “sticky” behavior of the flow and is proportional to the flow velocity w. The dynamic pressure drop is related to changes in either flow speed or flow direction, and it is proportional to 1/2ρw2. In a channel of cross-sectional area A, the volume flow Φ is related to the flow speed w through Φ = w· Acs. After summing the viscous and dynamic pressure drops of each section over the entire path through the box we get:
with fviscous and fdynamic as viscous and dynamic resistance factors summed over the total flow path. This total pressure drop is balanced by the buoyancy pressure:
Together, Equation (2) and Equation (5) form a system of two equations with two unknowns: the “better box” model. The solution of the equations yields the volume flow Φ through the box and (T1-T0), the temperature rise over the height of the box.
Loss Factors and CFD Experiments
Pressure loss factors are well described in literature. For the viscous pressure drop over a channel of length L and hydraulic diameter Dh, and with m the dynamic viscosity of air, the Poiseuille formula can be used:
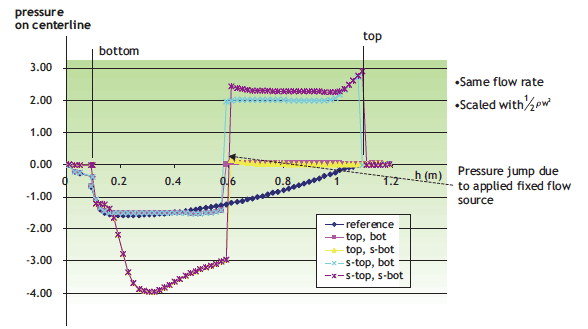
Figure 2. Scaled dynamic pressure drop over the box.
The dynamic pressure drop is proportional to 1/2ρw2, with proportionality factors depending on geometry. In case of a sharp 90 degree turn or in case of a contraction2 the proportionality factor found in literature is about 1.5 – 2.
CFD simulations are used as a virtual windtunnel to further look into the loss factors. Apart from the obvious advantage of numerical above real experiments, this also has the advantage that it enables separation of the viscous and the dynamic effects by comparing calculations with the air viscosity at 1% and at 100%.
A reference case is set up as a box 1 m wide, 1 m high, and 0.1 m deep, with 100 W power dissipation distributed uniformly over the entire volume of the box, and with the top surface and the bottom surface of the box open. For this reference system, the total air flow and the pressure distribution over the vertical center line of the box are calculated in natural convection situation in a combined temperature and flow simulation.
To calculate the dynamic loss factors, a flow-only simulation is performed with the same amount of flow as the reference situation, placed as a flow source at the horizontal mid plane in the box. The pressure distribution over the vertical centre line of the box was calculated, with the viscosity of air put at 1% of the real value to suppress viscous effects. The pressure was scaled with 1/2ρw2.
Figure 2 shows the results for an inlet on the bottom or on the side and an outlet on the top or on the top side. There is a pressure jump at h = 0.6 m, halfway through the box, at the location of the flow source. The results show the contraction loss at the inlet and the pressure losses from 90 degree turns in case of a side inlet or side outlet. The loss factors correspond well with the values found in literature. The results also show that the inlet and outlet areas are sufficiently separated from each other to allow addition of the dynamic pressure losses. No pressure effect is seen from the air exiting the box at the top outlet. There is no change in speed or direction of flow at this location, and there is no dynamic pressure effect.
An interesting phenomenom occurs in the reference situation: The pressure at the top of the box is very slightly below 0. The reason for this is that the plume of hot air leaving the set in the reference situation generates buoyancy pressure as well. In the reference situation, the buoyancy pressure from the plume is only about 0.01 Pa, so it is invisible in the graph. If we have a power source over a small height, located at the top of the box, this plume effect can be significant and the buoyancy pressure needs to be adjusted accordingly.
CFD simulations were also used to confirm that the Poiseuille formula matched the viscous pressure loss over the box and to derive a design rule for the pressure loss over the perforated vent areas at the inlet and outlet.
Results and Conclusion
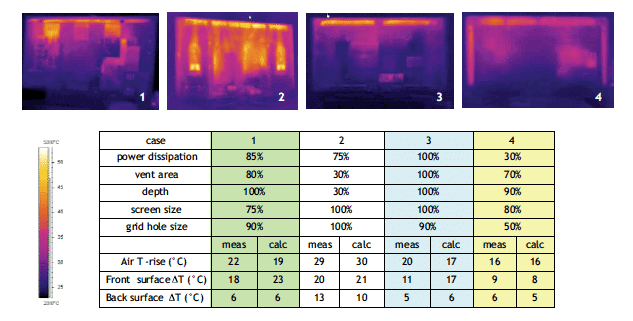
The better box model was implemented in a commercial spreadsheet, using the built-in solver. The spreadsheet was additionally adapted for use in TV development to accommodate for the presence of the display. In the adapted model, the temperature of the front (display side) and the back (non-display side) are treated separately. This adapted spreadsheet compared well to CFD simulation results for different 32 inch TV sets. The results of a comparison against thermal measurements for four other flat TV sets are shown in Figure 3.
Figure 3. Better box results vs. thermal measurements.
The better box results match well with the measurements. The comparisons to CFD and measurements show that the better box model can be used to judge if a certain product concept is suitable for fan-less cooling or not.
Since the better box spreadsheet only needs very limited information available in the pre-concept product design phase, runs very fast, and identifies opportunities for improved cooling, it can be used to identify and improve the more promising product cooling architectures in a pre-CFD stage in a very time efficient manner. This enables more effective and focused use of CFD time and CFD resources in the total product development cycle.
Acknowledgements
The author would like to thank the development departments of Philips Consumer Lifestyle for their support, especially Simon Kadijk and Vincent Rikkink of the Advanced Technology Centre Eindhoven.
Ir. G. A. (Wendy) Luiten
Thermal Specialist
Philips Applied Technologies
Advanced Technology Centre Eindhoven,
Philips Consumer Lifestyle
High Tech Campus Building 37-8023
5656AE Eindhoven, the Netherlands
Tel: +31 40 2749603
Email: Wendy.Luiten@philips.com
References
- Luiten, G. A. and Kadijk, S., “The Better Box Model”, Proceedings, Semi-Therm 2009, San Jose, CA, pp 70-75.
- Luiten, G. A., “Cooling of Electronics,” internal publication, Philips Consumer Lifestyle, 2008.
- Lasance, C. and Luiten, G. A., “Thermal Management from an Industrial Point of View”, course notes, Semi-Therm 2009.
- Idelchik, E., “Handbook of Hydraulic Resistance,” second edition, Hemisphere Publishing Corporation, 1986.


