Having read myriad papers/articles/books/reports on thermal management, I feel there is a lot of misunderstanding about what really should drive a sound approach of how to tackle the thermal problems that tend to land on the desk of thermal designers. I also have the feeling that many “how to” articles presented on the Web are just meant to show off the knowledge of the author and are full of correlations and equations, often emphasizing the dependence on temperature and consequently recommending iteration in one way or another.

The topic of this issue (and many to follow) is discussing the strange fact that many designers with a background in heat transfer don’t seem to realize that the equations/experiments in research-type wind tunnels, resulting in correlations/formulae they use on a daily basis are derived accurate data linking, e.g., the heat transfer coefficient h in a completely different environment than the one they to an average velocity v. Unfortunately, many professors are trying to address. Obviously, understanding the physics demand that the following step is to make the variables of heat transfer requires boundary and initial conditions dimensionless (e.g., rewrite h as Nu and v as Re) and plot that are reproducible. Many PhDs have spent four years Nu vs. Re on double-log paper, the rationale being that of their lives in performing repeatable and reproducible correlations are useful because they generalize the data: “For convenience of engineering applications, we have developed correlations over the whole range of Pr blablabla.” It is appropriate here to quote Professor Robert Moffat: “Reynolds number scaling is much more subtle than many heat transfer researchers think.”
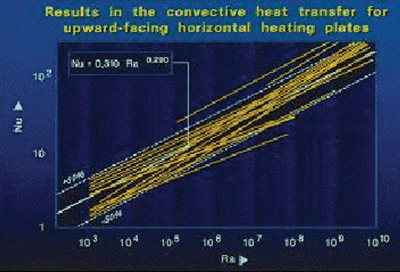
Let’s have a look at one of my favorite examples (also discussed in [1]) that will convince anybody that something is rotten in the state of correlations. In the early 1980s, Lewandowski and Kubski [2] presented a convincing example of the failure of correlation practice. They collected all known data about horizontal and vertical natural convection flat plate heat transfer (see Figure 1).
Despite the simple geometry, Figure 1 shows a 100% variation in published results, which is something to worry about because every individual line has been claimed to be accurate within 5% or so. The reason is that the ruling physics are much more complex than the researchers believed, and that every correlation is probably only valid for the range tested and cannot be extrapolated to other dimensions. In other words, many parameters are missing from the correlations.
In summary, people try, with great pains, to collapse an accurate set of data on a single line into a Nu plot, together with the accurate results of other research work, resulting in very inelegant equations with often intolerable scatter, only to demonstrate that non-congruent systems do not scale. Let’s quote Professor Moffat again: “Years of poorly controlled and inadequately described experiments have filled the literature with data that appear to be ‘comparable’ but are not.”
Here is the bottom line. We have a very simple problem (simple from a designer’s point of view; it is very complex from a physical point of view) that is a significant simplification of even the most simple PCB with only one component. When all individual data are plotted in dimensionless form, every single line claims 5% accuracy. Plotting all data together shows 100% difference. The conclusion is obvious: the most important reason for correlations – generalization –fails. The designer is stuck with the question: which correlation should I use? The only way to address this problem is to check the original data and select those sets that resemble more or less the problem at hand. Unfortunately, these data are never published and are probably gone forever.
I hope this example shows the reader that he or she should be careful with selecting correlations if some accuracy is the objective. My advice: refrain from correlations altogether. What is the alternative for the example above? For natural convection heat transfer (including some radiation) above a horizontal plate: h=10 W/m2K. I challenge all ASME professors to show me that their correlation does a better job in predicting heat transfer of a real PCB populated with some sources positioned horizontally in a relatively large enclosure.
References
- Lasance, C., “Sense and Nonsense of Heat Transfer Correlations Applied to Electronics Cooling”, Proc. EUROSIME 2005, pp.8-16.
- Lewandowski, W. and Kubski, P., “Methodical Investigations of Free Convection from Vertical and Horizontal Plates,” Warme-and Stoffuebertragung, Vol.17, 1983, pp.147-154.


