Madhusudan Iyengar and Roger Schmidt
IBM, Poughkeepsie, New York
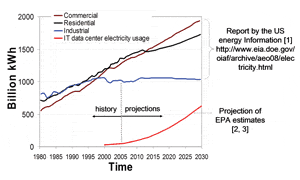
Many of our day-to-day activities, including Internet searches, handheld electronics usage, automated cash withdrawal, and online hotel and airline reservations, require the use of remote databases and computational infrastructure comprised of large server farms located at some faraway location from the consumer. Comparable computer facilities also support several critical functions of national security and are indispensible for reliable functioning of our economy. These Information Technology (IT) data centers now consume a large amount of electricity in the U.S. and world-wide. As illustrated in Figure 1, in addition to the issue of the total energy used by IT data centers, the projected usage can be estimated to rise much faster than the other industrial sectors [1-3]. The projections were determined by fitting a curve to the available data and extrapolating into the future. Thus, the topic of data center energy efficiency has attracted a large amount of interest from industry, academia, and government regulatory agencies [4, 5].
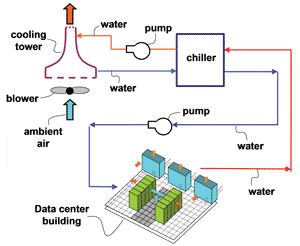
Cooling has been found to contribute about one third of the energy use of IT data centers and is the focus of this article. Figure 2 displays a schematic of the cooling loop of a typical data center [6]. In such a data center, sub-ambient temperature refrigerated water leaving the chiller plant evaporator is circulated through the Computer Room Air Conditioning (CRAC) units using building chilled water pumps. This water carries heat away from the air-conditioned raised floor room that houses the IT equipment and rejects the heat into the refrigeration chiller evaporator via a heat exchanger. The refrigeration chiller operates on a vapor compression cycle and consumes compression work (compressor). The refrigerant loop
rejects the heat into a condenser water loop using another chiller heat exchanger (condenser). A condenser pump circulates water between the chiller condenser and an air cooled evaporative cooling tower. The air cooled cooling tower uses forced air movement and water evaporation to extract heat from the condenser water loop and transfer it into the ambient environment. Thus, in this “standard” facility cooling design, the primary cooling energy consumption components are: the server fans, the computer room air conditioning unit (CRAC) blowers, the building chilled water (BCW) pumps, the refrigeration chiller compressors, the condenser water pumps, and the cooling tower blowers.
There are many variations to the plant level cooling infrastructure illustrated in Figure 2. For example, the CRAC could be comprised of a refrigerant loop with an air-cooled roof-top condenser, or the chiller might be eliminated with cooling tower water being routed to a water-to-water economizer heat exchanger, or the outside air could be directly introduced into the data center rooms. The cooling configuration at the server and in its immediate vicinity could also vary significantly. All these and other such “non-standard” configurations are not discussed in this article.
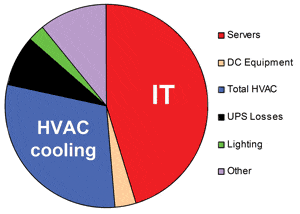
Figure 3 provides a typical breakdown of the energy usage of a data center using a chilled water loop as depicted in Figure 2. The IT equipment usually consumes about 45-55% of the total electricity, and total cooling energy consumption is roughly 30-40% of the total energy use. As discussed earlier, the cooling infrastructure is made up of three elements, the refrigeration chiller plant (including the cooling tower fans and condenser water pumps, in the case of water-cooled condensers), the building chilled water pumps, and the data center floor air-conditioning units (CRACs). About half the cooling energy used is consumed at the refrigeration chiller compressor and about a third is used by the room level air-conditioning units for air movement, making them the two primary contributors to the data center cooling energy use.
Figure 4 depicts the energy flow for a typical data center facility that consists of all the elements that have been discussed above. A detailed description of the thermodynamic model summarized in this paper can be found in the literature [6, 7].
The total electrical pumping power consumed in cooling the data center facility via the various daisy chained loops shown in Figure 4 can be given by [6, 7],
Ptotal = Prack,total +PCRAC +PBCW +Pchiller +PCTW +PCTA (1)
where Ptotal, Prack,total, PCRAC, PBCW, Pchiller, PCTW, and PCTA are the powers consumed by the total facility for cooling, server fans in rack cluster being cooled in the data center room, data center room air-conditioning units, building chilled water pumps, refrigeration chiller plant, cooling tower pumps, and by the cooling tower fans, respectively. Except for the Pchiller term, all the elements making up the right hand side of eq.(1) can be calculated using the equation below,
P = ∆P x flow / η (2)
where P, ∆P, flow, and η are the coolant pumping power (air or water) at the motor (W), the line pressure drop (N/m2), the coolant volumetric flow rate (m3/s), and the motor electromechanical efficiency, respectively.
To calculate the pressure drop used in eq. (2), one can estimate the coolant line pressure drop, ∆P, using,
∆P = C2 x flow2 (3)
where C represents the coolant pressure loss coefficient through the rack (server node, rack front and rear covers), the air-conditioning unit (CRAC) and the data center floor associated with a specific CRAC unit, the building chilled water loop piping, the cooling tower water loop piping, or the cooling tower air-side open loop, respectively. Except for the CRAC flow loop pressure loss coefficient terms, all the other coefficients can be calculated or derived using empirical data from building data collection systems or manufacturer’s catalogues for the various components. The pressure loss arising from flow through the under floor plenum of a raised floor data center and through the perforated tiles is usually an order of magnitude smaller than the pressure loss through the CRAC unit itself. The pressure drop through the CRAC unit is made up primarily from the losses due to the tube and fin coils, the suction side air filters, and several expansion, contraction, and turning instances experienced by the flow [6, 7].
Pchiller is the work done at the refrigeration chiller compressor and is calculated using a set of equations that characterize the chiller. While there are several analytical models in the literature which help characterize chiller operation, a version of the Gordon-Ng model [8] was chosen by the authors [6, 7] for its simplicity and the ease with which commonly available plant data can be analyzed to find the model coefficients. The chiller thermodynamic work is a function of the heat load at its evaporator, the temperature of water entering the condenser, the desired set point temperature of the water leaving the evaporator, as well as several other operating and design parameters including the loading of the chiller with respect to its rated capacity.
While the calculation of the cooling power for the different coolant loops displayed in Figure 4 is relatively straightforward, the thermal analysis is significantly more complex. For example, the heat removed by the cooling tower needs to be equal to the sum of the heat rejected at the refrigeration chiller condenser and the energy expended by the condenser water pumps. Another example of the thermal coupling necessary to satisfy energy balance is that the heat extracted by the CRAC units needs to be equal to the sum of the heat dissipated by the IT equipment and the CRAC blowers. Detailed models for the calculation of the heat transfer that occurs in various parts of the facility cooling infrastructure depicted in Figure 4 can be found in literature [7].
For the results shown in this article, two cases are considered for which the relevant input conditions are described below. A 350 rack cluster is assumed, with each rack consisting of 42 “pizza box” servers which are each 1U tall (1U = 1.75” or 44.45 mm). Each rack has an estimated maximum power dissipation of 16.8 kW and a rack air flow rate of 2160 cubic feet per minute (1.02 m3/s). Assuming two 100 W CPUs for every server, and another 200 W of supporting device heat load, one can assume 400 W/U server load yielding a rack of 16.8 kW for a 42U tall rack. A 2000 ton (1 ton = 3.517 kW) refrigeration chiller is used for cooling this data center.
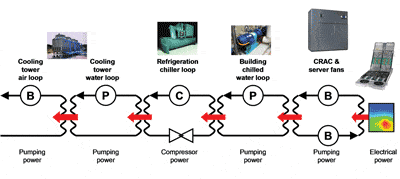
Figure 5(a) shows sample results [6] of thermodynamic analyses using the model [5] that was briefly discussed in the preceding text. This result represents a typically inefficient configuration. For this base line case the chiller supplies 6oC water to the CRACs when the outside air is at 30oC (wet bulb) with a relative humidity of 90%. The servers are assumed to be dissipating only 50% of the initially estimated full load of 16.8 kW, thus, only 8.4 kW. Such configurations are not uncommon. The actual power drawn could be much less than the nameplate information, or the servers might be idle. Thus, although the chiller is rated for 2000 tons (7032 kW), it is being loaded to only 62%. For this case, it is assumed that half the air supplied by the CRAC units is being misdirected to locations other than the cold aisle, that is, a leakage flow of 50% [9]. Thus, the CRAC units are supplying twice as much chilled air flow as is required to satisfy 100% flow through the racks, which is also quite common. A total cooling power of 2.62 MW is consumed for cooling 2.94 MW of server electronics heat load. Counter to what may be expected, the chiller contribution to the energy consumption is not the largest fraction (28%), but the CRAC power consumption is at 42%. The cumulative contribution of the chillers and CRAC is as expected, at 80%. All 101 CRAC units are running at the highest speeds, even though the servers are powered to only 50% of their estimated maximum capacity.
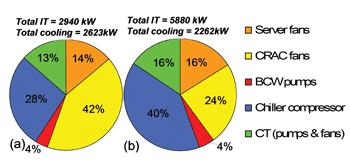
A good explanation also exists as to why the chiller power consumption is relatively low. This low consumption is due to the chiller running at only a 62% load. While this lowers the chiller COP, the total chiller power use is still lower than what it would be at full load. The server fans are found to consume 14% of the total. The fans used for this example are typical 40-mm fans and are at the lowest efficiency portion of the spectrum with respect to server air-moving devices. A higher-performance blower used in a high-end server application can be expected to be much more electromechanically efficient. The value of the plant COP was found to be 1.12; that is, for every 1.12 W of IT data center power consumed, 1 W of cooling power was used. It should be noted here that this paper does not characterize non-cooling parasitic power consumption such as UPS losses, electrical line losses, and building heating and cooling energy usage.
Figures 5(b) depict the results [6] for the changes implemented to the inefficient base line case that was discussed through Figure 5(a). For example, the total power consumption for IT systems in this data center increased from 50% to 100% by running all the servers at the maximum estimated load. The raised-floor leakage reduced from 50% to zero, thus providing a CRAC flow that exactly matched the IT rack flow. Lastly, the environmental conditions of the ambient air and the chilled water set-point temperature are both changed favorably with respect to cooling energy efficiency. The chilled water set-point is increased to from 6oC to 15oC and the ambient air wet bulb temperature was reduced from 30oC to 20oC and the ambient relative humidity was changed from 90% to 50%. As illustrated in Figure 5(b), for this efficient case, the resultant plant-level COP is a significantly higher value of 2.7.
It is not our intention to exhaustively run a large number of parametric trials to show the trends by components and for individual operating parameters. The goal of this article is to provide a general discussion highlighting global energy trends in the context of the IT industry, to briefly discuss physically sound analytical models that allow cooling energy estimations, and to present in summary some model results that demonstrate the use of such models in identifying pain points. As such, the analyses described in the preceding section illustrate the substantial energy efficiency opportunities prevalent in IT data centers and some design and best practices measures that can be implemented to realize the energy savings.
References
Report by the U.S. Energy Information, Report#: DOE/EIA-0383(2008), Release date full report: June 2008; Next release date full report: February 2009.
Report to Congress on Server and Data Center Energy Efficiency Public Law 109-431 U.S. Environmental Protection Agency ENERGY STAR Program, August 2, 2007, http://www.energystar.gov/ia/partners/prod_development/downloads/EPA_Datacenter_Report_Congress_Final1.pdf
Iyengar, M., Schmidt, R., and Caricari, J., “Reducing Energy Usage in Data Centers through Control of Room Air Conditioning units”, Proceedings of the IEEE ITherm Conf., Las Vegas, USA, 2010.
Belady, C., “In the Data Center, Power and Cooling Costs More than the IT Equipment It Supports,” ElectronicsCooling, Vol. 13, No 1, February 2007.
Brill, K., “The Invisible Crisis in the Data Center: The Economic Meltdown of Moore’s Law,” Uptime Institute, available at http://uptimeinstitute.org/wp_pdf/(TUI3008)Moore’sLawWP_080107.pdf
Schmidt, R. and Iyengar, M., “Thermodynamics of Information Technology Data Centers”, IBM J. Res. & Dev. Vol. 53, No. 3, Paper 9, 2009.
Iyengar, M., and Schmidt, R., ‘‘Analytical Modeling for Thermodynamic Characterization of Data Center Cooling Systems,’’ Trans. ASME J. Electronic Packaging, Vol. 131, June, 2009.
Gordon, J. M., and Ng, K. C., ‘‘Predictive and Diagnostic Aspect of a Universal Thermodynamic Model for Chillers,’’ Trans. Intl. J. Heat Mass Transfer 38, No. 5, 807–818, 1995.
Hamann, H., Iyengar, M., and O’Boyle, M., ‘‘The Impact of Air Flow Leakage on Server Inlet Air Temperature in a Raised Floor Data Center,’’ Proceedings of the InterSociety Conference on Thermal and Thermomechanical Phenomona (ITherm), May 28–31, 2008, pp. 1153–1160.
Madhusudan Iyengar, Ph.D., can be reached at mki@us.ibm.com. Roger R. Schmidt, Ph.d, P.E., can be reached at C28RRS@us.ibm.com.


