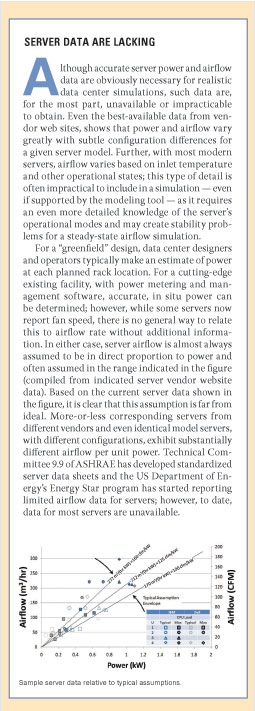
The question to be addressed in this article is: Do you really need a traditional CFD package to design or manage your data center under all circumstances? Are there any practical alternatives on the cooling-analysis spectrum between it and spreadsheet calculations by your in-house cooling guru? What are the consequences of unreliable input data for important geometric details and server power and airflow (see sidebar, “Server Data Are Lacking,” on Page 15)?
Recently, alternatives to full CFD have been discussed in the technical literature [1-8], some of which even provide CFD-like 3D velocity, pressure, and temperature predictions. Such tools can be used directly or incorporated within a more comprehensive data center design and management software package [9].
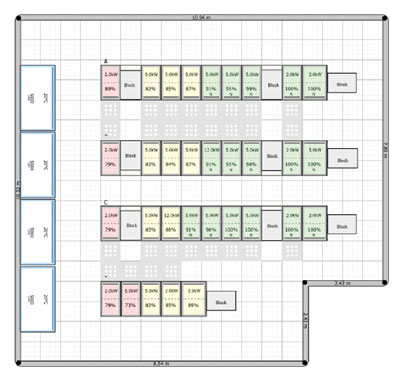
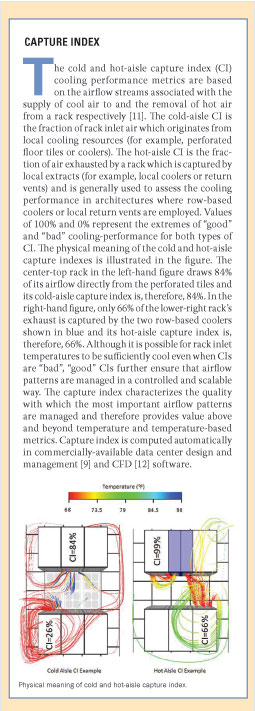
In the initial planning stages for a new facility or modification, what is most needed is a dynamic go/no-go indication of cooling performance as the design takes shape. For example, racks and perforated tiles can be re-colored instantly based on cooling performance and airflow rate, respectively, as you move objects and change settings. Although the attractive colored planes and airflow vectors familiar from CFD tools provide real engineering value, simple empirical predictions can be used to provide a quick estimate of rack cooling performance. For example, estimating a single average rack inlet or cooler return temperature for all such objects provides greater value-per-effort than predicting the temperature at all points in the data center. In Figure 1, racks are colored based on a metric termed “capture index” (see sidebar, “Capture Index,” on Page 16), which is a measure of the quality with which air is delivered to rack inlets and captured from rack exhausts. The rack-level-empirical model approach works particularly well when equipment is arranged in geometrically regular groupings surrounding a hot or cold aisle, extreme examples of which are cold and hot aisle containment systems.
Several empirical rack-level cooling prediction techniques have been developed, for example [1-3], and the simplest techniques fit algebraic models to the airflow physics as determined by simple CFD analyses. With this approach, thousands of CFD simulations of simpler building-block units of data centers are analyzed covering the range of input parameters in the tool, then the models are “tuned” to provide the best fit to the CFD data. In other words, the accuracy of a CFD solution is still leveraged but the time and complexity associated with running models is moved “off line”. The resulting models are robust and simple enough to run every time the model is changed. Using the rack-level algorithms discussed above, one can predict capture index and, by extension, average rack inlet temperatures, average cooler return temperatures, and cooler loads.
While rack-level empirical models can form the key “cooling calculation engine” of data center design and management tools, many users would also like to “see” airflow vectors, temperatures, and pressures – just like CFD. For this purpose, and also for the very practical purpose of predicting perforated tile airflow rates, a Potential Flow Model (PFM) can be employed. The term “potential flow” applies to an irrotational velocity field. When the flow can also be assumed to be incompressible, velocities can be determined from Poisson’s Equation. For general room-airflow predictions (e.g., above the raised floor in the data center white space), pressures are never explicitly required; however, they are needed when modeling pressure-dependent flow boundary conditions such as perforated floor tiles. Finally, once airflow patterns are known, temperatures may be determined from the energy equation.
Compared to the formidable set of Navier-Stokes equations solved by traditional CFD, the potential flow model is, indeed, straightforward. Solutions are well behaved and convergence is achieved quickly and predictably. By using an efficient unstructured grid and optimized solution-control parameters, even full 3D room-level solutions can be obtained in several seconds on common computing hardware.
What do we have to give up for this tremendous improvement in solution time and robustness? Since rotationality — neglected in PFM — is often present in highly-viscous regions, potential flow solutions lack the ability to capture strong jet-like flow features, turbulence, and recirculation zones. Further, since the flow field is determined independently from the momentum and energy equations, buoyancy is neglected. Is this a reasonable assumption? It would not be reasonable for predicting airflow in general buildings where buoyancy may be a primary flow driver, but, in data centers, airflow patterns are generally dominated by the large amounts of airflow driven by racks and coolers. A recent study [10] concluded that airflow is generally dominated by momentum when the typical temperature rise across a rack is on the order of 10°C but when that figure rises to 20°C or more buoyancy becomes important.
Accuracy requirements must be tied to overall objectives. For data center design and management purposes, it is often enough to generally predict the correct bulk movement of airflow around racks and coolers which will, at least, reveal which areas are sufficiently cooled, inadequately cooled, or marginal. A high level of airflow-prediction accuracy may be wasted in most practical scenarios where the input data is either poorly estimated or impractical to include in the model.
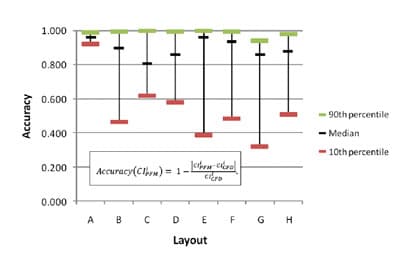
Considering the issue of accuracy more quantitatively, several recent studies [4-8] have assessed the use of PFM for data center cooling prediction. A study of 8 data center layouts, based on actual modern facilities [7], produced the comparisons of the capture index of PFM to CFD shown above (Figure 2). For example, layout A represents a standard best-practices raised-floor facility utilizing alternating cold and hot aisles with the Computer Room Air Conditioners (CRACs) aligned with the hot aisles. In this case, over 90% of PFM predictions are better than 93% accurate and 10% of the predictions are better than 98% accurate. For every layout, predictions for over half the
racks are better than 80% accurate. Average inlet temperature predictions are of similar accuracy to capture index, however, as might be expected, maximum rack inlet temperatures, which are local in nature, are not predicted very accurately by PFM.
Of course, if server and other input data can be accurately captured, traditional CFD will, indeed, yield better predictions. Further, commercial CFD packages typically provide a rich set of tools for modeling such things as equipment with pressure or flow-dependent control, unique architectural features of the building, and transient processes; all of which may be beyond the scope of design and management tools which utilize PFM. Additionally, CFD provides particularly better accuracy in cases where there is strong coupling between the room and under-floor plenum, such as when large-open-area perforated tiles are used.
Potential Flow Model Example
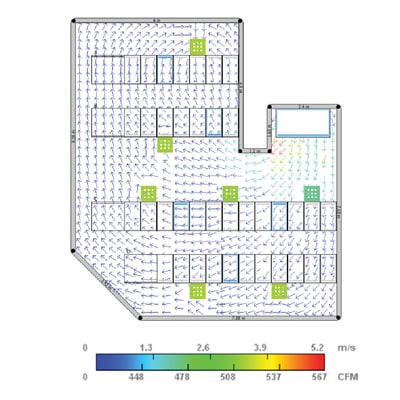
First consider a plenum airflow application where the primary goal is to estimate perforated tile airflow rates. In this case, a depth-averaged 2D model is sufficient and calculations run instantaneously on any modern computer [6]. In other words, drag in a new cooling unit or move a perforated tile and the flow vectors and perforated tile flow rates (Figure 3) are updated instantly as new objects are added or settings are modified. This is a much different user experience than that of CFD which typically involves a lot of time waiting for results and subsequently comparing two or more static solutions.
While 2D plenum calculations run faster than full 3D room calculations, the plenum application actually involves extra steps. Since perforated tile airflows are a primary output of the analysis, they are unknown at the beginning of the analysis and must be related back to pressure differences across the tiles based on tile performance data. Consequently, plenum pressures need to be computed and coupled to the airflow solution necessitating additional iteration.
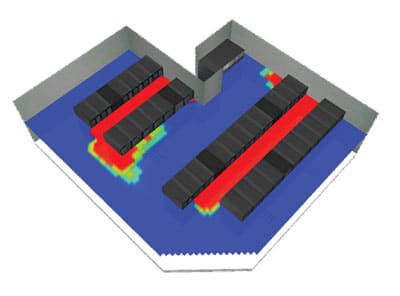
Once the perforated tile airflow rates are determined, they can be used as boundary conditions for the 3D PFM solution for the above-the-raised-floor portion of the facility. This calculation is not quite real time but runs in just a few seconds on common computers, even for very large rooms. Velocity vector and temperature results (Figure 4) look like those from traditional CFD and provide the same ability to quickly locate problem spots and understand the underlying causes.
Summary
Data center design and management software utilizing the methods discussed here can be used to quickly optimize a data center design with much less time, cost, and specialized training than required by CFD. Further, at least one such package [9] provides the ability to export models to an XML neutral file format or directly to the native file format of a data center and buildings modeling CFD package [12]. This allows the user to leverage the advantages of both PFM and CFD tools.
Returning to our initial question: do you really need the accuracy of a full CFD package? Or are simple empirical models and PFM “good enough”? Given the poor quality of and limited time available for collecting the required input data and the huge improvements in speed and usability as compared to CFD, these new tools represent a very attractive alternative for many data center design and management applications.
References
[1] VanGilder, J., and Shrivastava, S.K., 2006, “Real-Time Prediction of Rack-Cooling Performance”, ASHRAE Transactions, Vol. 112, Part 2, pp. 151-162.
[2] VanGilder J., Zhang, X., and Shrivastava, S.K., 2007, “Partially Decoupled Aisle Method for Estimating Rack-Cooling Performance in Near-Real Time”, Proceedings of InterPACK’07, International Electronic Packaging Technical Conference and Exhibition, July, Vancouver, Canada.
[3] Shrivastava, S.K., VanGilder, J. and Sammakia, B.G., 2007, “Use of Artificial Neural Network in Data Center Cooling Prediction”, Proceedings of InterPACK’07, International Electronic Packaging Technical Conference and Exhibition, July, Vancouver, Canada.
[4] Lopez, V. and Hamann, H., 2010, “Measurement-Based Modeling for Data Centers”, Proceedings of ITHERM, June 2-5, Las Vegas, NV.
[5] Hamann, H., Lopez, V., and Stepanchuk, A., 2010, “Thermal Zones for More Efficient Data Center Energy Management”, Proceedings of ITHERM, June 2-5, Las Vegas, NV.
[6] VanGilder, J., Sheffer, Z., Zhang, X., and Healey, C., 2011, “Potential Flow Model for Predicting Perforated Tile Airflow in Data Centers”, ASHRAE Transactions, Vol. 117, Part 2.
[7] Healey, C., VanGilder, J., Sheffer, Z., and Zhang, X., 2011, “Potential-Flow Modeling for Data Center Applications”, Proceedings of InterPACK, July 6-8, Portland, OR.
[8] Toulouse, M., Doljac, G., Carey, V., and Bash, C., 2009, “Exploration of A Potential-Flow-Based Compact Model of Air-Flow Transport in Data Centers”, Proceedings of IMECE, November 13-19, Lake Buena Vista, FL.
[9] StruXureWare for Data Centers. http://www.apc.com/site/software.
[10] Demetriou, D.W. and Khalifa, H.E., 2011, “Evaluation of a Data Center Recirculation Non-Uniformity Metric Using Computational Fluid Dynamics”, Proceedings of InterPACK, July 6-8, Portland, OR.
[11] VanGilder, J. and Shrivastava, S.K., 2007, “Capture Index: An Airflow-Based Rack Cooling Performance Metric,”ASHRAE Transactions, Vol. 113, Part 1, pp. 126-136.
[12] FLOVENT by Mentor Graphics, http://www.mentor.com/products/mechanical/products/flovent.

