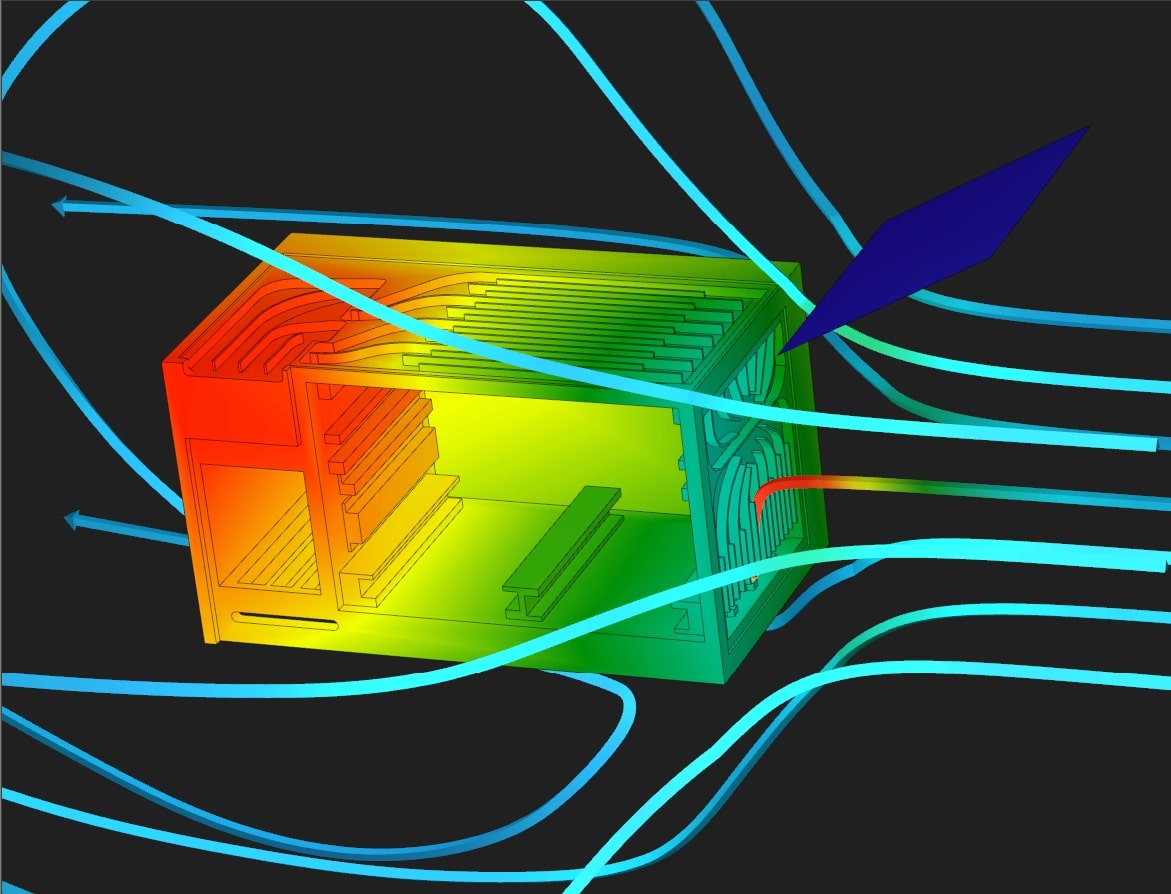
One new tool is solution volume visualization using color fog. Typically, fog depicts temperature or pressure variations and its opacity can be controlled, allowing the user to view obscured objects. When combined with sectional view planes, fog helps the user to quickly analyze complex spatial distributions.
Daat Research has also introduced an automatic flow visualization and animation. Based on previously available streamrods and streamribbons, the new one-click option automatically distributes injectors throughout the solution field and injects particles that show flow direction, velocity, swirl, as well as the local value of a scalar variable, such as temperature, at the particle’s location.


