Part 1 of this article provided the groundwork for the present discussion [1]. It demonstrated the use of three different methodologies for performing a transient thermal analysis of a high-power IC package attached to a heat sink. These include the finite element analysis (FEA) method and a numerical model, which represents the package and heat sink using a multistage RC (resistor-capacitor) network. It presented the details for implementing the numerical model in a spreadsheet and demonstrated its accuracy using simplifying assumptions regarding the package and heat sink configuration – namely that all of these components have the same width as the die. Since the resultant one-dimensional heat flow can be represented quite accurately using simple analytical expressions, it provided a rigorous test of the ability of the numerical model to accurately represent the transient aspects of the heat transfer problem in this layered structure.
Part 2 applies the same two methodologies to a more realistic representation of a high-power package attached to an air-cooled heat sink, in which the widths of the components are unequal (heat sink > package lid > silicon die) and the heat flow from the die to the ambient air via the heat sink is non uniform.
Furthermore, Part 2 uses a method, described in the context of a steady-state analysis of the same package, employing the concept of an isothermal Heat Transfer Area (HTA). The application of this concept enables a simplified approach for calculating the thermal resistance of the package lid and thermal interface material between the lid and heat sink base (TIM2) and the heat sink-to-air thermal resistance [2, 3].
Methodology
Assumptions
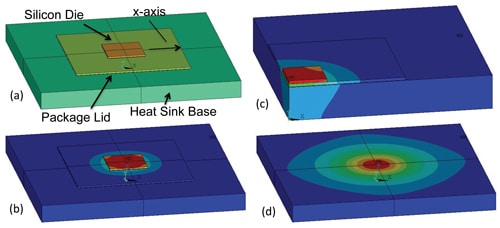
The construction of the package and associated heat sink has been described in great detail in previous installments of this column [1, 2, 3]. Figure 1a illustrates the appearance of these components as represented in the FEA model.
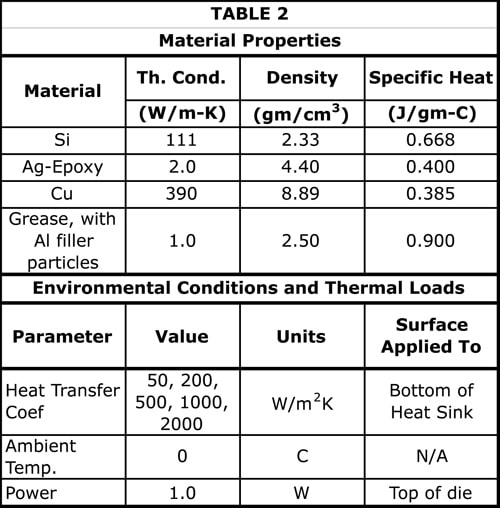
In this model, two simplifying assumptions were made: 1) heat flow to the package substrate (attached to the reverse side of the die in the actual application) and then to the PCB is neglected (since in a high-power package application it is of secondary importance) and 2) the cooling effect of heat sink fins is represented by the application of a suitable heat transfer coefficient (HTC) directly to the heat sink base. Hence, the only components explicitly represented in the model are the die, TIM1, lid, TIM2, and the heat sink base (where TIM = Thermal Interface Material). A wide range of HTC values is assumed in the analysis, ranging from 50 to 2000 W/m2K, as described in Table 2.
The quantitative assumptions of the model are listed in Tables 1 and 2. Note that the stated values of component dimensions, material composition, and thermal resistance are consistent with those in recent articles [1, 2, 3]. Note also that, for convenience, the ambient temperature was assumed to equal zero. Hence, the reported component temperatures correspond to the temperature rise with respect to the ambient. The power is assumed to increase in a stepwise fashion from 0W to 1W at time 0.
Numerical Model
The numerical model employed here uses a 3-stage RC network topology, as illustrated in Figure 2. Resistance values for each of the pure conduction components (die, TIM1, lid, and TIM2) are calculated assuming 1-D heat flow, using the following formula:
(1)
where the value for the width is equal to a) the actual width for components experiencing a 1-D heat flow pattern (die and TIM1) or to b) the HTA Width for those components involved in a diverging flow situation (lid and TIM2). Note that a value of HTA Width of 17.5 mm has been calculated for the current package in contact with the same copper heat sink, independent of the value of HTC [3]. R1 and C1 are each equal to the sum of the respective R and C values for the die and TIM1. The same relationship exists between R2 and C2 and the individual values of R and C for the lid and TIM2.
The heat sink-to-air thermal resistance (equal to R3) is calculated using an analytical procedure described in Ref. [5], inputting the heat sink dimensions, thermal conductivity, the value of HTC, and the heat source size (equal to the HTA Width) [5].
The heat capacity of the pure conductive components is calculated from:
C = Specific Heat * Density * Volume (2)
where the volume is calculated using either the actual component width or the HTA Width as indicated above.
The calculation of the heat capacity of the heat sink is a bit more complicated, since the network model assumes an isothermal temperature for the heat sink, corresponding to that of the T3 node in the diagram in Figure 2. However, the temperature distribution within the heat sink is often quite non-uniform, as we shall see. The only way these two facts can be reconciled is to assume an effective volume for the heat sink (smaller than the actual volume), which stores the same quantity of heat at a uniform temperature (essentially the maximum temperature in the actual heat sink) as is stored by the actual physical heat sink having a range of internal temperatures.

In this case, we define a new parameter WHS-CAP to represent the width of this effective energy storage volume such that the heat capacity of the heat sink, CHS, is equal to
CHS = Specific Heat * Density * tHS * W2HS-CAP (3)
where tHS is the heat sink thickness. C3 in the network is set equal to CHS.
Calculating the appropriate value of CHS is not straightforward due to the non-uniform heat sink temperature. In the following section, the sensitivity of the calculation accuracy to varying CHS is determined. Various methods are explored for calculating the optimum value of CHS (or equivalently, WHS-CAP).
FEA Model
The results of the numerical model are compared with those from a commercial FEA software package [4]. For the purposes of this comparison, the FEA values are considered to represent an “exact” solution.
THERMAL SOLUTIONS
Figures 1b and 1c show the temperature contours, for a full and quarter model respectively, plotted on the surfaces of the package, lid, and heat sink, resulting from an FEA calculation at an HTC value of 2000 W/m2K. The complicated thermal gradient field in the heat sink base should be noted, with components in both the vertical and radial directions, as is evident from Figures 1c and 1d.

Figure 3 contains graphs comparing solutions of the numerical model, for two different values of WHS-CAP , 25 and 51 mm, with the FEA solution versus time. The results are plotted using both linear and logarithmic time scales. The results for each value of WHS-CAP manifest two different behaviors for the calculated value of heat sink temperature (T3). In the log-time plot for the 25 mm case, the curve representing T3 calculated by the numerical model shows an oscillation that is symmetrical about the FEA value of T3. On the other hand, that for the 51 mm case is smaller than the FEA value. These two behaviors result in a reasonably accurate transient behavior for the die (T1) for the 25 mm case, but one which is slower in response for the 51 mm solution.
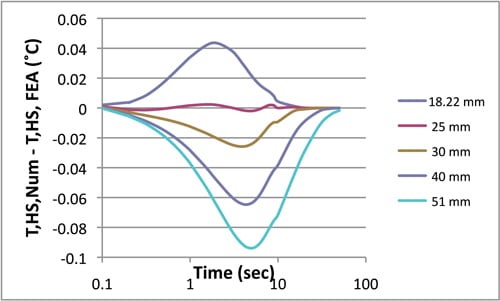
Figure 4 plots the difference between the heat sink temperature curves calculated using the numerical model (at various values of WHS-CAP) and one using the FEA method. The best agreement was achieved using the 25 mm value for WHS-CAP. The peak-to-valley amplitude for each of these difference curves is used in a subsequent analysis to compare the relative accuracy of the numerical model calculated using different values of WHS-CAP for situations involving other values of HTC.

sink, along x-axis: a) values normalized to peak temperature; b)
non-modified temperature values.
Figure 5 compares temperature profiles (from FEA models) for the top surface of the heat sink along the x-axis calculated for different values of HTC. In Figure 5a the local temperature is divided by the peak temperature (occurring at x=0) having the effect of normalizing the peak temperature to a value of 1. Quite clearly, the temperature is more highly peaked in the case of higher values of HTC and is much more uniform for the lowest values. This suggests that smaller values for WHS-CAP would be appropriate for use in the numerical model at large values of HTC and conversely for small values of HTC.
Figure 5b plots the actual surface temperatures versus distance along the x-axis. As expected, the lower values of HTC lead to much higher average heat sink temperatures.
Figure 6a shows calculated values of WHS-CAP, obtained by a variety of calculations. They are described below.
First a couple of definitions are provided to assist that discussion.
• Th,iso = heat sink-to-air thermal resistance assuming an isothermal heat sink =
•Th,spr = heat sink-to-air thermal resistance assuming a heat spreading situation =
Th,spr = f(WHS-Actual, tHS, kHS, HTC, HTA Width) (5)
where f is a function specified in Ref. [5] and kHS is the thermal conductivity of the heat sink.
Competing Methods for Calculating WHS-CAP:
1. Best fit: for each value of HTC, determine by inspection, the value of WHS-CAP showing the minimum peak-to-valley amplitude for a curve of THS-Num – THS-FEA, as was demonstrated using Figure 3.
2. Use the ratio: Th,iso/Th,spr * WHS-Actual
3. Use the ratio: (Th,iso/Th,spr)2 * WHS-Actual
4. Use the average of methods 2 and 3
5. Use the average HS temperature, calculated from FEA over the entire volume of the heat sink, and the following expression:
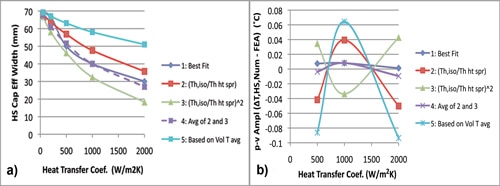
a) WHS-CAP values plotted versus the heat transfer coef. b) values of peak-to-valley amplitude of T,HS difference curves: numerical minus FEA results. Best performance at value = 0.
Looking in detail at Figure 6a, one sees that, as expected, all the calculated values of WHS-CAP decrease with increasing HTC. However, for values of HTC of 500 W/m2K and greater, there is a large disparity between the values of WHS-CAP calculated using the various methods.
Figure 6b shows the results from calculating the peak-to-valley amplitude for curves of THS-Num – THS-FEA for the higher HTC cases (500, 1000, and 2000 W/m2K). The best fit method shows a very small error as does method 4. The other methods show much worse behavior. This indicates a narrow range of values of WHS-CAP that can lead to the THS,Num curve essentially lying on top of the curve for THS-FEA (albeit with some oscillation present.) Furthermore, it is telling that using the value of WHS-CAP obtained using Method 5 (which was calculated using a conservation of thermal energy argument) leads to poor results for cases at these higher values of HTC. However, Method 5 works well at small values of HTC (50 and 200 W/m2K, where the heat sink temperature distribution is relatively uniform.
At the higher values of HTC, the temperature of the heat sink at the center is appreciably different from that at its edges. This suggests that the use of a single temperature node to represent the entire heat sink volume is too severe for these higher HTC cases. In these situations, it is to be expected that dividing the heat sink into at least two concentric regions represented by two nodes would provide a more robust model and reduce the incidence of oscillations of the THS-Num curve about that representing THS-FEA. Hence, the exercise of controlling the value of WHS-CAP within a narrow range is one of “tuning” the phase of the numerical model with respect to the FEA model so that the numerical model essentially oscillates about it in the region of most rapid temperature rise of the heat sink.
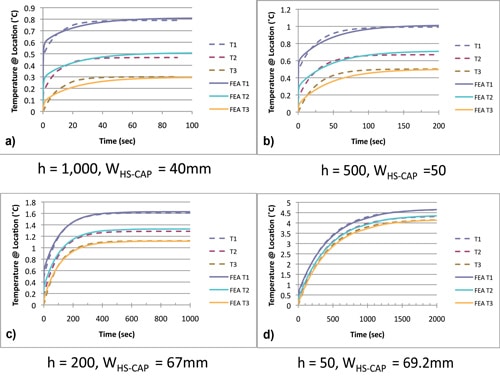
Figure 7 contains graphs, comparing the FEA results with numerical results obtained using the best fit values of WHS-CAP. Note that for HTC = 50 and 200 W/m2K, the best fit values correspond to those obtained using method 5, and that these curves demonstrate no oscillations, suggesting that the current RC network topology does an adequate job of representing the physics of the situation. At HTC equal to 500 and 1000 W/m2K, there is some oscillation of the numerical results about the FEA curves. However, the numerical curves oscillate in a symmetrical fashion, improving the phase coherence between the two curves.
CONCLUSIONS
A simple lumped element numerical model was shown to have reasonable accuracy when compared to FEA results subject to the choice of an appropriate value for WHS-CAP.
A technique was demonstrated for calculating near-optimum values of WHS-CAP, using the ratio of the isothermal and heat spreading values for the thermal resistance-to-air of the heat sink in a simple algebraic expression. However, it is not clear whether this is a robust correlation or merely fortuitous in this limited study. Further analysis involving other heat sink configurations (such as those in References 2 and 3) would be required.
The numerical model performs in a robust manner when the heat sink temperature distribution is relatively uniform. However, at values of HTC ≥ 500 W/m2K, obtaining reasonable phase coherence between the numerical and FEA models depends on choosing a value of at or near the best-fit value. Under these circumstances, the benefit of improving model stability would be well worth the effort to increase the number of nodes representing the heat sink.
REFERENCES
1. B. Guenin, “Transient Modeling of a High-Power IC Package, Part 1,” Electronics Cooling, Vol. 17, No. 4, Winter, 2011.
2. B. Guenin, “Thermal interactions Between High-Power Packages and Heat Sinks, Part 1,” Electronics Cooling, Vol. 16, No. 4, Winter, 2010.
3. B. Guenin, “Thermal interactions Between High-Power Packages and Heat Sinks, Part 2,” Electronics Cooling, Vol. 17, No. 1, Spring, 2011.
4. ANSYS®, Version 13.0
5. S. Lee, “Calculating Spreading Resistance in Heat Sinks,” Electronics Cooling, Vol. 4., No. 1, January 1998.


