Mahmoud Ibrahim
Panduit Corporation
The continuous growth of internet business and social media is necessitating the construction of new data centers to support the rising volume of internet traffic. This is in addition to the increasing number of colocation facilities being built to support different business sizes with different functions. Generally, data centers are considered mission critical facilities that house a large number of electronic equipment, typically servers, switches, and routers that demand high levels of electrical power which eventually dissipates as heat. These facilities require a tightly controlled environment to ensure the reliable operation of the IT equipment. In many cases, with the IT equipment being a core player in the customer-business relationship regardless of the sole function of the business (healthcare, finance, social media, etc.), fearing the presence of hotspots within the facility, facility managers and data center operators tend to unnecessarily overcool their data centers. This explains why in the 2007 EPA report to Congress it was estimated that U.S. data centers used 61 billion kWh of electricity in 2006, representing 1.5% of all U.S. electricity consumption and double the amount consumed in 2000 [1]. Consequently, data center cooling technology has gained considerable research focus over the past few years in an effort to lower these high levels of energy consumption.
Dynamic cooling has been proposed as one approach for enhancing the energy efficiency of data center facilities. It involves using sensors to monitor continuously the data center environment and making real time decisions on how to allocate the cooling resources based on the location of hotspots and concentration of workloads. In order to effectively implement this approach, it is vital to know the transient thermal response of the various systems comprising the data center, which is a function of thermal mass.
Another crucial requirement for mission critical facilities, in addition to providing adequate cooling to IT equipment, is securing constant electrical power supply. A survey conducted by Ponemon Institute on data center outages [2] stated that 88% out of 453 surveyed data center operators experienced a loss of primary utility power and hence the power outage of their data centers, with an average of 5.12 complete data center outages every two years. When an outage occurs, it is standard practice to continue to furnish power to the servers using uninterruptable power supplies (UPSs) for a period of time. This allows the fans in the server to continue to operate while allowing sufficient time for the server to attempt a controlled shutdown. However, without active cooling the ambient air temperature within the data center will rise. How quickly the data center environment reaches the critical limit of the IT equipment is once again a function of thermal mass. A number of studies have addressed this issue and developed simple energy based models to predict the data center room temperature rise during power failure [3-4]. While such models may provide useful information, they are based on combining all parameters in the data center into one, so as to provide an overall sense of the thermal response. These models however are not capable of providing a detailed view of the data center whether during dynamic cooling control or during power failure. In order to do so, the thermal mass of the various objects present in the data center must be determined.
This article introduces an experimental technique used to extract the thermal mass of servers, which can further be used as a compact model embedded in Computational Fluid Dynamics (CFD) simulations for data center level analyses, or analytical based thermal models. All the experimental testing and results presented are conducted on a typical 2U server used in the market.
APPROACH
In order to obtain a thermal mass of the server, the following energy balance equation is applied:
where Q ̇is the total energy generated by the server per unit time, m is the air mass flow rate within the server, and (pVcp)unit is the thermal mass of the server. The first term on the right-hand side of Equation 1 represents forced convection cooling by the server fans, with the second term accounting for the server thermal storage. Measuring the air velocity inside the server, the power consumed, the air temperature rise () across the server and a representative temperature of the server with time, one can extract the thermal mass. Although it appears straightforward since all the variables are measured, obtaining a server unit temperature Tunit poses difficulties that require further assumptions.
iven that the server is comprised of numerous components, obtaining an appropriate average temperature of the unit as a whole requires a weighted allocation of the individual components. The major components that may have an effect on the average unit temperature are CPU/heat sink assemblies, hard disk drives, graphic card, memory modules, fans, power supply unit, and the chassis including the motherboard. The primary materials used in the production of these various components are aluminum, steel, copper, and silicon. Knowing that the specific heat capacity of the above materials within the range of 0.5-0.9 KJ/kg.K, and that the range of heat capacity for condensed matter is 1-4 J/m3.K [5], one can assume that the contribution of each component to the unit temperature will be solely determined by the ratio of the component weight to the overall server weight. By obtaining the weights of the various server components, the percentage contribution of each component to the overall unit temperature can be computed. The unit temperature is then calculated by multiplying each component’s percentage by its measured temperature as represented by Equation (2). The equation coefficients represent the relative mass of each component.

The server was located in a large room to insure a uniform inlet ambient air temperature, not affected by the server exhaust temperature. Type J thermocouples with a measurement uncertainty of ±1.1oC, and a thermal response time of less than 1 second were used for temperature measurement. The thermocouples were attached in various locations to measure temperatures of the different components within the server, as well as the air intake and exhaust temperatures (Figure 1). The thermocouples were attached using a thermal adhesive tape to obtain the best possible thermal contact. A data acquisition (DAQ) unit was used to log the temperature data. A power meter was used to measure the power consumed by the server with an accuracy of ±1% and a response time less than 5 seconds.
In addition to the thermocouples, the server is equipped with sensors from the manufacturer, taking temperature measurements of different components, as well as measuring the four CPU fans’ speed. Software was installed to log the reported fan speed measurements and temperature measurements by the various components in the server. Data was collected every three seconds, and it was synchronized between the three sources: power meter, DAQ unit, and server sensors using the clocks on each computer.
Figure 1 shows a top view of the server, highlighting where the thermocouples were placed. Fourteen thermocouples were used to obtain an average server air outlet temperature, so as to account for the large variation in outlet temperature across the width of the server.
Through operating the server at a specific power level and measuring the corresponding temperatures, fan speeds, and power consumption, one can extract the server thermal mass using Equation (1). Various power levels were tested to ensure the validity and accuracy of the approach. All the tests were conducted in an identical manner, where the server was operated initially at idle state and the temperature measurements were used to determine a steady state operation. Steady state condition was determined by observing that the server air exhaust temperatures as well as the component surface temperatures remained constant (±0.5oC) for at least 10 minutes. A computational load is applied to the server to run it at a specific power level causing component surface temperatures and server exhaust temperature to increase. Loads applied to the server varied from 220W to 350W while the fan airflow was kept constant. Once a steady state is reached, computations are terminated allowing the server to go back to its idle state.


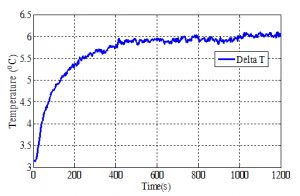
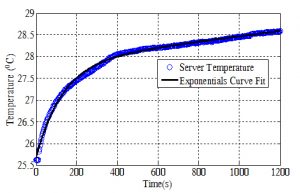
Figures 2 and 3 show one of the experimental runs used to determine the thermal mass of the server. The server power consumption (Q) is constant at 350 W, while the fans are operating at maximum speed of 12,000 RPM. The flow rate (m) at this speed is about 6.61E-2 kg/s. In Figure 2, the measured air temperature rise across the server (∆Tair) as a function of time is shown. The corresponding increase in the average server temperature (∆Tunit) is shown in Figure 3, which is curve fitted using an exponential function. The component temperatures ranged from 27oC for the chassis to 75oC for the CPU. By finding the derivative of the function with respect to time, along with the power, flow rate, and temperature difference across the server, the server thermal mass is obtained using the method of least squares. For this particular run, the computed thermal mass was 11.3 kJ/K.

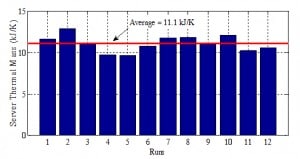
The summary of all runs is shown in Figure 4 with an average thermal mass value of 11.1 kJ/K. The corresponding average percent error for each run compared to the average thermal mass value is ±7%. The range of server power tested was 220 W to 350 W, which is a typical range for a 2U server, with the server power at idle been 150 W. The server thermal mass is expected to be similar for a wider range of powers as it is a characteristic of the server.
With the obtained server thermal mass, the server can be treated as a black box in which for a given scenario with specified inlet air flow rate and temperature, and server power consumption, the server outlet air temperature can be obtained with time. For data center operators this is primarily the information they would require, rather than being concerned with the details of the temperature distribution within the server. This model can also be used to construct a CFD model that represents a server behaving similarly to the 2U server tested here. The CFD model would approximately account for the thermal mass of the server, allowing a transient investigation. A room level CFD model can be populated with these simple server models and the transient thermal response of the data center can be investigated for different scenarios. Although not evaluated yet, cases such as power shutdown or cooling equipment failure can be modeled in CFD to account for the transient response of the IT equipment.
REFERENCES
[1] U.S. Environmental Protection Agency ENERGY STAR Program, 2007, “Report to Congress on Server and Data Center Energy Efficiency Public Law 109-431,” http://www.energystar.gov/ia/partners/prod_development/downloads/EPA_Datacenter_Report_Congress_Final1.pdf.
[2] Ponemon Institute, 2010, “National Survey on Data Center Outages,” Retrieved from http://www.ponemon.org/local/upload/file/Data_Center_Outages.pdf.
[3] Khankari, 2010, K., “Thermal Mass Availability for Cooling Data Centers During Power Failure Shutdown,” ASHRAE Transactions, 116(2), 205-217.
[4] Zhang, X., and VanGilder, J., 2011, “Real-Time Data Center Transient Analysis”, ASME 2011 Pacific Rim Technical Conference and Exhibition on Packaging and Integration of Electronic and Photonic Systems, MEMS and NEMS: Volume 2, pp. 471-477.
[5] Wilson, J., 2007, “Thermal Diffusivity,” ElectronicsCooling Magazine, 13(3), https://electronics-cooling.com/2007/08/thermal-diffusivity/.


