Milnes P. David, Robert Simons, David Graybill, Vinod Kamath, Bejoy Kochuparambil, Robert Rainey and Roger Schmidt ; IBM Systems & Technology Group, Poughkeepsie, New York and Raleigh, North Carolina
Pritish Parida, Mark Schultz, Michael Gaynes and Timothy Chainer; IBM T.J. Watson Research Center, Yorktown Heights, New York
INTRODUCTION
Data centers now consume a significant fraction of US and worldwide energy (approximately 2% and 1.3% respectively); a trend which continues to increase, particularly in the cloud computing space [1,2]. Energy efficiency in data centers is thus a key issue, both from a business perspective, to save on operating costs and to increase capacity, and from an environmental perspective. Traditional chiller-based data centers, which dominate the market, typically have a PUE ~ 2 where PUE is Power Utilization Effectiveness, defined as the ratio of the total data center power consumption to the power consumed by the IT equipment alone. Ideally energy consumed outside of the IT equipment, such as by the electrical and cooling infrastructure, would be kept to a minimum leading to a PUE close to one. Traditionally only half the total data center energy is used at the equipment with typically about 25%-40% of the total data center energy consumed by the cooling infrastructure. Most of this is consumed by the site chiller plant, used to provide chilled water to the data center, and by computer room air conditioners (CRAC) and air handlers (CRAH), used to cool the computer room. Several earlier publications have shown that significant energy savings can be obtained by reducing the annual operating hours of, or even completely eliminating, the chiller plant and CRAH/CRACs units [3-5]. A project, jointly funded by the US Department of Energy (DOE) and IBM, was conducted at the IBM site in Poughkeepsie, NY, to build and demonstrate a data center test facility combining direct warm-water cooling at the server level and water-side economization at the facility level, to maximize energy efficiency and reduce the cooling power to less than 10% of the IT power (or <5% of the total data center power). Key elements of the design and results are presented in this article, with additional details available in references [6-11].
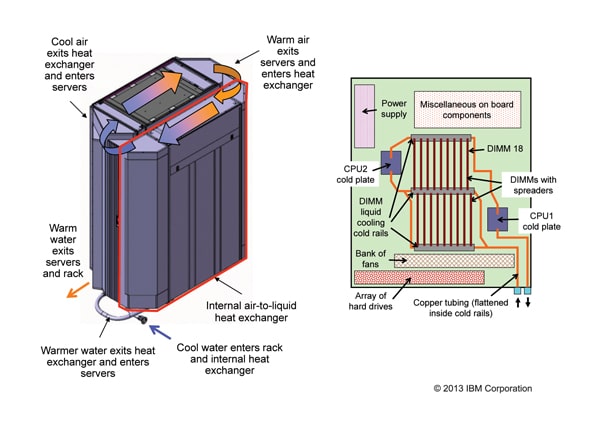
Direct liquid cooling of the IT equipment has been shown to offer both performance enhancements and energy savings [12-14]. It was further chosen for this program to enable warmer-water cooling and subsequently expand the use of free-air cooling over the year and to a wider geography. The IT equipment rack, shown in Figure 1, is comprised of 40 1U (1U = 44.45mm) 2-socket volume servers (often used for cloud applications), dissipating approximately 350 W each, with a total rack heat load of 14 kW. The processors are conduction cooled using cold-plates, and the memory modules by heat spreaders attached to cold rails. Measurements made comparing the device temperatures in an air-cooled server with the hybrid air & water-cooled version showed that the CPU junction temperatures were 30°C cooler when using 25°C water (in the air & water-cooled server) versus 22°C air (in the air-cooled server) [8]. Similarly, memory module temperatures were on average 18°C cooler and generally more uniform in the water-cooled server versus the air-cooled server. Such reductions in device temperatures can yield improvements in server performance and reliability and enables the use of warmer-water cooling. For example, at 45°C water temperature, the processor temperatures were below that of their counterparts cooled with 22°C air and the memory temperatures were nearly the same. Approximately 60%-70% of the heat dissipated at the server level is directly absorbed by the water circulating in the server level cooling hardware. Since less air flow is required at the server, three of the six server fans were removed, reducing IT power consumption. Heat that is not directly absorbed by the water-cooled server hardware is absorbed by the water flowing through the internal rack-enclosed air-to-liquid heat exchanger. Air is circulated through this internal heat exchanger by the remaining server fans and then returned to the servers in a closed loop, with no air exchange with the computer room. This fully enclosed rack design results in almost complete heat removal (~99%) to circulating water, protection from room air contamination and a very quiet rack. This combination of server-level direct water cooling and rack-level air-to-water cooling enables expanded warm-water (and thus free-air) cooling, elimination of energy-intensive and expensive computer room air conditioning and reduction in the number of server level fans and their associated power consumption and noise.
WATER-SIDE ECONOMIZED DATA CENTER
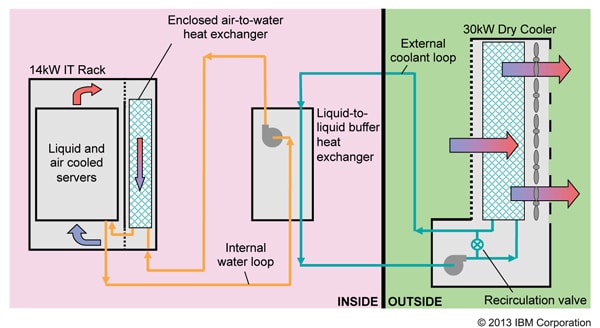
Water or air-side economization utilizes ambient external conditions directly to offset some or all the necessary cooling, thereby reducing or eliminating intermediate refrigeration. Air-side economization utilizes outside air to provide the necessary cooling [15,16]. Filtration and humidification/ dehumidification of the incoming air is necessary to lessen any risk associated with condensation, arcing, fouling or corrosion [17]. Water-side economization uses an intermediate economizer liquid-to-liquid heat exchanger to connect the facility water loop to the building or system water loop. This heat exchanger either supplements or completely replaces the chiller plant. In our data center test facility (shown in Figure 2), a 30kW capacity dry cooler, with 5 controllable fans, a facility coolant pump and a recirculation valve for use in the winter, is directly plumbed to a liquid-liquid buffer heat exchanger unit. No intermediate chiller is installed, resulting in significant energy and capital cost savings. The facility water supply temperature is allowed to vary with the ambient dry bulb temperature. Though a wet cooling tower can expand use of this data center architecture over most locations in the US and worldwide, dry coolers are attractive where water is expensive or difficult to obtain. As shown in Fig. 2, a dual loop data center design was used, which isolates the facility side coolant loop, containing a 50% water-propylene glycol mix, from the internal system loop containing distilled water. The propylene glycol mix was chosen based on the historic minimum of -34ºC in Poughkeepsie, New York. Though a single coolant loop arrangement is also possible, simulations found that the use of the propylene glycol mix, which has poorer thermal properties and is more viscous, in the full loop, reduces the potential thermal and pumping power improvements [9]. Separating the loops also has the advantage of needing to maintain a high coolant quality (anti-corrosives, fungicides, bactericides, filtration, etc.) only on the system side.
Cooling Performance Characteristics
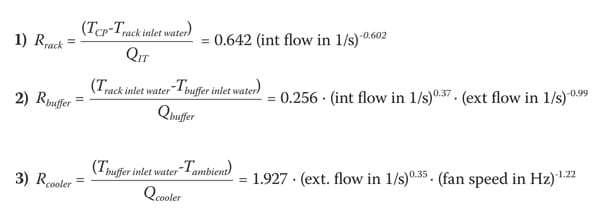
The cooling characteristics of the rack level hardware, buffer heat exchanger and dry cooler as well as the cooling equipment power consumption were modeled using empirical functions derived from a series of characterization experiments, discussed in detail in reference [6]. The thermal resistances relationships obtained for pure water in both the internal and external loops are,
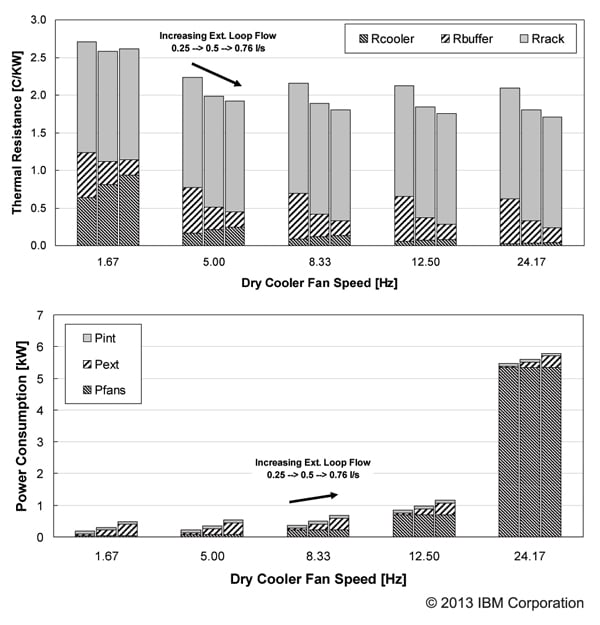
Figure 3 shows the predicted CPU coldplate to outside dry bulb thermal resistance (determined from Eqs. 1-3) and the corresponding cooling equipment power for an internal loop flow rate of 0.25 l/s (4 GPM) and as external loop flow rate and dry cooler fan speed are varied. The results show that the total thermal resistance is dominated by the coldplate to rack inlet water thermal resistance. If the internal loop flow is increased to 0.5 l/s (8 GPM) this portion reduces significantly. The buffer thermal resistance reduces while the dry cooler resistance increases as external loop flow is increased. The cooler resistance reduces with increasing fan speed but the improvement is small after 8.3 Hz (500 RPM). Figure 3 (bottom) shows the total power consumption where Pfans is the power consumed by the dry cooler fans, Pext is the power consumed by the external loop pump and Pint is the power consumed by the pump in the buffer unit that drives flow in the internal loop. The total power consumption doesn’t change significantly until fan speeds of 8.3 Hz (500 RPM) but then dramatically increases up to the maximum 24.2 Hz (1450 RPM). Reference [6] further discusses the impact of adding propylene glycol to the external loop. These results highlight the importance of characterization to help determine the most energy efficient operating ranges for the different pieces of cooling equipment and in turn for developing the most ideal control algorithms to provide additional energy savings.
SYSTEM OPERATION AND CONTROLS
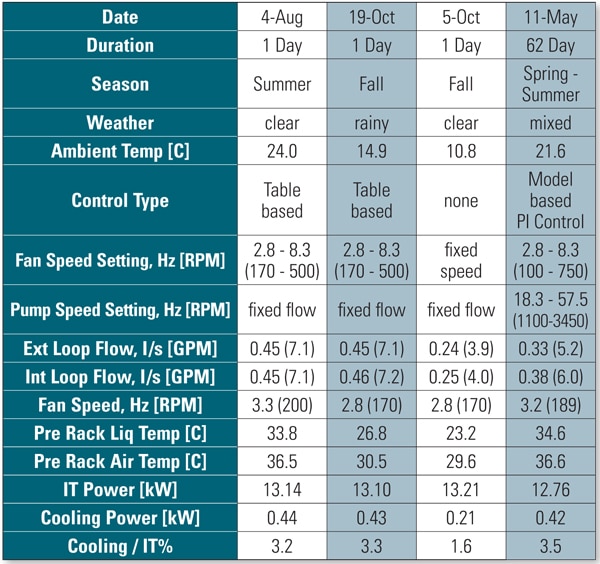
To study the actual energy consumption under operating conditions and to determine the cooling PUE (also referred to as mechanical PUE) several one day runs were carried out under simple table based control algorithms where the required equipment speeds are linearly interpolated for between user defined discrete settings. A long two month run was also carried out using a more sophisticated Proportional-Integral (P-I) control algorithm, details of which are discussed in references [10,11]. The control algorithms were implemented via a monitoring and control platform that was designed to allow both real-time tracking of system and facility environmental and power states as well as control of the dry cooler fans, internal and external loop pumps and external loop recirculation valve. Summary results from the various one day runs as well as the two month run are shown in Table 1. Both the simple table based control and the P-I control implementation leads to similar cooling energy consumption of approximately 420-440W. However, the dynamic P-I control system was able to maintain the rack inlet water temperature, on average, within 0.5°C of the set-point of 35°C over the two month period. This helps maintain a more constant environment for the IT equipment and reduces reliability issues associated with rapid changes in operating environment. The cooling energy use of 420W for an IT load of 13kW translates to a cooling PUE of approximately 1.035 or a Cooling to IT power ratio of 3.5%. Compare this with a Cooling to IT power ratio of almost 50% for a traditional chiller based data center and this represents an over 90% reduction in data center cooling energy use. For a typical 1 MW data center this would represent a savings of roughly $90-$240k/year at an energy cost of $0.04 – $0.11 per kWh.
CONCLUSION
The results of this project demonstrate the extreme energy efficiency attainable in a water-side economized data center with water-cooled volume servers, and support the development and deployment of other similar systems. One large-scale commercial implementation of a similar architecture is the 3PFlop SuperMUC HPC system unveiled in 2012 at the LRZ in Munich, Germany [18]. The SuperMUC system, which shares some technological features with this project, is currently ranked 9th on the Top500 list based on performance [19] and 15th greenest system (considering only 1MW+ systems) on the Green500 list based on a performance per watt of 846 MFlop/Watt [20].
ACKNOWLEDGEMENT
This project was supported in part by the U.S. Department of Energy’s Industrial Technologies Program under the American Recovery and Reinvestment Act of 2009, award no. DE-EE0002894. We also thank the IBM Research project managers, James Whatley and Brenda Horton, DOE Project Officer Debo Aichbhaumik, DOE Project Monitors Darin Toronjo and Chap Sapp, and DOE HQ Contact Gideon Varga for their support throughout the project.
REFERENCES
[1] J.G. Koomey, “Growth in Data Center electricity use 2005 to 2010”, Oakland, CA: Analytics Press., Aug 2011.
[2] R. Brown et al., “Report to Congress on Server and Data Center Energy Efficiency: Public Law 109-431,” Lawrence Berkeley National Laboratory, 2008.
[3] M. Iyengar, R. Schmidt, J. Caricari, “Reducing Energy Usage in Data Centers Through Control of Room Air Conditioning Units,” 2010 12th IEEE Intersociety Conference on Thermal and Thermomechanical Phenomena in Electronic Systems (ITherm), Jun 2-5, 2010, pp. 1-11.
[4] ASHRAE Datacom Series, “Best Practices for DataCom Facility Energy Efficiency,” 2nd Edition, Altanta, 2009.
[5] Vision and Roadmap – Routing Telecom and Data Centers Toward Efficient Energy Use, May 13, 2009, www1.eere.energy.gov/industry/dataceters/pdfs/vision_and_roadmap.pdf.
[6] M. P. David et al. “Impact of operating conditions on a chiller-less data center test facility with liquid-cooled servers,” 2012 13th IEEE Intersociety Conference on Thermal and Thermomechanical Phenomena in Electronic Systems (ITherm), San Diego, CA, May 30–Jun 1, 2012, pp. 562 – 573.
[7] M. K. Iyengar et al., “Server liquid cooling with chiller-less data center design to enable significant energy savings,” 2012 28th Annual IEEE Semiconductor Thermal Measurement and Management Symposium (SEMI-THERM), Mar 18-22, 2012, pp. 212–223.
[8] P. R. Parida et al. “Experimental investigation of water-cooled server microprocessors and memory devices in an energy efficient chiller-less data center,” 2012 28th Annual IEEE Semiconductor Thermal Measurement and Management Symposium (SEMI-THERM), Mar 18-22, 2012, pp. 224–231.
[9] P. R. Parida et al. “System-Level Design for Liquid-cooled Chiller-Less Data Center”, ASME 2012 International Mechanical Engineering Conference and Exposition (IMECE), Nov 9-15, 2012, Paper No. IMECE2012-88957, pp. 1127-1139.
[10] M. P. David et al., “Dynamically Controlled Long Duration Operation of a Highly Energy Efficient Chiller-less Data Center Test Facility,” 2013 12th ASME International Technical Conference and Exhibition on Packaging and Integration of Electronic and Photonic Microsystems (InterPACK2013), July 16-18, 2013, Paper# InterPACK2013-73183.
[11] P. R. Parida et al., “Cooling Energy Reduction During Dynamically Controlled Data Center Operation,” 2013 12th ASME International Technical Conference and Exhibition on Packaging and Integration of Electronic and Photonic Microsystems (InterPACK2013), July 16-18, 2013, Paper# InterPACK2013-73208.
[12] M. J. Ellsworth et al., “An Overview of the IBM Power 775 Supercomputer Water Cooling System,” J. Electron. Packag., 2012, 134(2):020906-020906-9.
[13] M. J. Ellsworth and M. Iyengar, “Energy Efficiency Analyses and Comparison of Air and Water-cooled High Performance Servers,” Proceedings of ASME InterPACK 2009, July 19-23, 2009, Paper# IPACK2009-89248, pp. 907-914.
[14] J. Wei., “Hybrid Cooling Technology for Large-scale Computing Systems – From Back to the Future,” ASME 2011 Pacific Rim Technical Conference and Exhibition on Packaging and Integration of Electronic and Photonic Systems, MEMS and NEMS: Vol. 2, July 6-8, 2011, Paper# IPACK2011-52045, pp. 107-111.
[15] Timothy P. Morgan, “Yahoo! opens chicken coop data center,” The Register, Sep. 2010, http://www.theregister.co.uk/2010/09/23/yahoo_compute_coop/
[16] C. Metz, “Welcome to Prineville, Oregon: Population, 800 Million”. Wired, Dec. 2011, http://www.wired.com/wiredenterprise/2011/12/facebook-data-center/
[17] M. Iyengar et al., “Energy Efficient Economizer Based Data Centers with Air-cooled Servers,” 2012 13th IEEE Intersociety Conference on Thermal and Thermomechanical Phenomena in Electronic Systems (ITherm), May 30 – Jun 1, 2012, pp. 367-376.
[18] H. Huber et al., “Case Study: LRZ Liquid Cooling, Energy Management, Contract Specialities,” 2012 SC Companion: High Performance Computing, Networking, Storage and Analysis (SCC), Nov, 2012, pp.962-992.
[19] Top500 List – June 2013, accessed: Oct 28, 2013, http://www.top500.org/list/2013/06/
[20] The Green500 List – June 2013, accessed: Oct 28, 2013, http://www.green500.org/lists/green201306

