Takashi Fukue and Koichi Hirose
Dept. of Mech. Eng., Iwate University
Tomoyuki Hatakeyama and Masaru Ishizuka
Dept. of Mech. Syst. Eng., Toyama Prefectural University
Katsuhiro Koizumi
Cosel Co., Ltd.
Introduction
Forced convection driven by cooling fans is widely used for removing heat from electronic equipment. A net cooling performance of the cooling fans is significantly dependent on a supply flow rate. Therefore, accurate prediction of cooling fan performance is extremely important in the thermal design of fan-cooled electronic equipment.
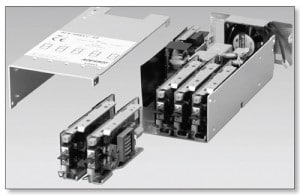
Generally, the supply flow rate of the fans is decided by the intersection of its pressure (DP) – flow rate (Q) characteristic curve, which shows the relationship between the pressure rise at the fan (DP) and the supply flow rate (Q), and a flow resistance curve of electronic equipment. In recent years, electronic equipment has become smaller and thinner while their performance increases and their functions become more complex. As a result, a lot of electrical devices are mounted in electronic equipment and the airflow passage in high-density packaging electronic equipment such as SMPS (Switched-Mode Power Supply), laser printers, lap top computers and servers becomes narrow and complex because gaps between mounted components generally become the flow passage. The pressure drop characteristic in such equipment may not be predicted easily by using well-known basic pressure drop characteristics [1]. In addition, several components such as heat sinks, capacitors and an enclosure are installed near the fan as shown in Figure 1. This may affect the fan performance itself [2]. Several researchers have evaluated the fan performance when the components are mounted near the fan [3] – [5]. Therefore, the accurate prediction of the supply flow rate of the fan mounted in equipment is generally difficult. A further investigation of how the accurate supply flow rate of the fan mounted in electronic equipment is predicted rapidly and easily is required in order to shorten a design period while maintaining reliability of products.
With this as a background, this present study focuses on an investigation of the supply flow rate in electronic equipment [2] [6]. In this article, the relationship between the supply flow rate of the small axial fan which is mounted at the outlet of the enclosure and the flow passage area in electronic equipment is reported as an example of our investigation. To investigate a change of the fan’s flow rate in high-density packaging electronic equipment, a test enclosure which includes a test fan and an obstruction was prepared. The obstruction simulated electrical components in front of the fan. A change of the supply flow rate of the fan was measured while changing the obstruction and an opening area of an air inlet of the enclosure. We then explored the relationship between the supply flow rate and the flow pass area in order to obtain information for estimating the supply flow rate easily. Here, in this article, we investigated the supply flow rate when electronic equipment is mounted at the upstream side of test fans. Moreover we assumed that one axial fan is mounted at the air outlet of electronic equipment and fan-mounted electronic equipment operates in ambient atmosphere.
Measurement System of Supply Flow Rate
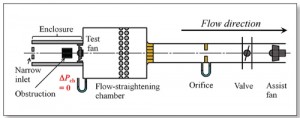
Figure 2 shows the schematic of our system for measuring the supply flow rate of the fan mounted in the test enclosure. It comprises an enclosure part that models the external enclosure of electronic equipment and the fan performance measurement system designed by Nakamura and Igarashi [7] based on JBMS-72-2003 [8]. This system is made up of an enclosure part with a test fan, a chamber part, an orifice, a valve, and an assist fan. Removal of the enclosure converts the system to the JBMS-72-2003 measurement system. The flow rate, Q, is measured at the orifice. An analog valve and the assist fan can be used for controlling the static pressure in the chamber. As mentioned above, we investigated the supply flow rate of the fan when the fan-mounted electronic equipment operates in ambient atmosphere. Therefore in this paper, the supply flow rate of the test fan when DPch = 0 Pa was measured while changing the opening area of the narrow inlet and the obstruction. The static pressure difference DPch was measured with a highly accurate differential pressure gauge (Shibata Kagaku, ISP-350, range; 0 – 500 Pa).
Test Fans
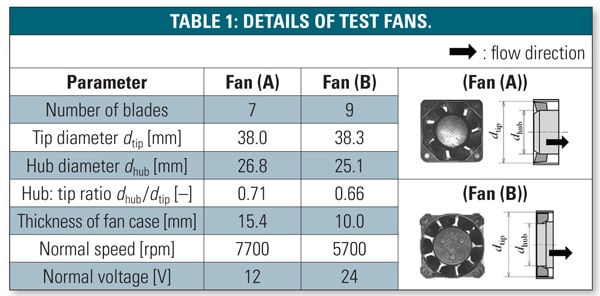
Table 1 shows the details of the test fans. In this study, two types of 40 mm-scale fans, with a fan case of about 40 mm ´ 40 mm, were measured. Here, dtip is a fan tip diameter and dhub is a fan hub diameter. When we conduct the measurement, the voltage was adjusted to run the fan at a rated rotation speed, which was checked by a stroboscope.
Test Enclosure
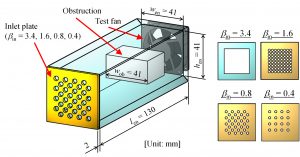
Figure 3 (a) shows a schematic diagram of the test enclosure used in this study. Air flows into the enclosure from the surroundings through an inlet and exhausted to the atmosphere via the test fan. The width and the height of the enclosure (wen, hen) were set at 41 mm and the length len was set at 130 mm. Figure 3 (b) shows the shapes of the enclosure inlet. Table 2 shows the list of the total inlet area. 5 types of the inlet plate were used. The condition of the area of the inlet was evaluated by using bin. This is the ratio of the total inlet area Ain divided by the fan flow area Atip. Atip is expressed using the following relationships. Here, As is the profile area of the struts between the casing and the hub.
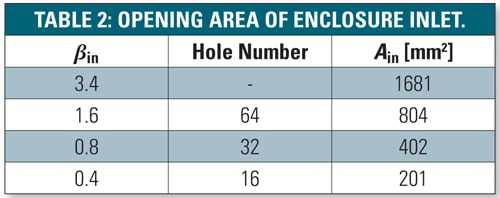
In actual electronic equipment, the inlet area is varied according to the air inlet structure such as the existence of perforated plates and filters for a dust control. Therefore the value of bin was set at between 0.4 and 3.4.
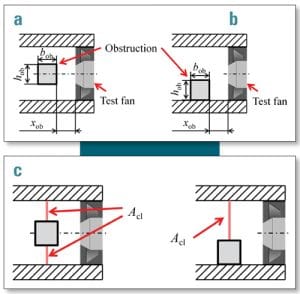
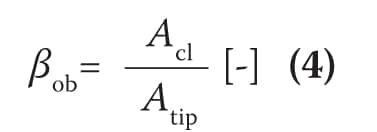
Figure 4 and Table 3 show the details of the obstruction mounted in the enclosure. To simulate the actual electrical components in electronic equipment, a rectangular obstruction was mounted in front of the fan while changing the dimensions of the obstruction and the mounting position. Here, the ratio of flow passage area Acl divided by the fan flow area Atip is defined as the flow area ratio bob. Here, Acl is defined as:
bob is expressed using the following formula:
The value of bob was set at between 0.9 and 2.6. The distance between the fan and the obstruction was changed from 5 mm to 40 mm.
Experimental Results
Figures 5 and 6 show the change of the operating flow rate of each fan when the enclosure is mounted in front of the fan. Here, we evaluated the supply flow rate by using the non-dimensional flow rate (Q / Qmax). Qmax is the flow rate when there is no enclosure and obstruction.


We investigate the relationship between the supply flow rate and each opening area ratio. The deterioration of the flow rate becomes significant when bin becomes smaller than 1.0. Even if bin is larger than 1.0, the supply flow rate decreases when bob = 0.9. Here, Figure 7 shows the relationship among the supply flow rate, bob and bin. The supply flow rate approaches the maximum flow rate in the case that both bob and bin becomes larger than 1.0. When either bob or bin becomes smaller than 1.0, the deterioration of the supply flow rate is caused.

From these results, we can conclude that the supply flow rate of the fan is decreased according to the flow pass area. Of course, the fan’s supply flow rate deteriorates when the number of the mounted components increases. The components increase the pressure drop in the enclosure regardless of their dimensions. However, when the flow pass area in electronic equipment becomes smaller than the fan’s flow area, the deterioration of the supply flow rate becomes significant. On the other hand, when the flow pass area in the enclosure is larger than 1.0, the deterioration of the flow rate can be inhibited.
Here, when the dimensions of the obstruction become larger, the distance between the fan and the obstruction xob also affects the supply flow rate; the supply flow rate decreases when the position of the obstruction is near the fan. We previously reported that the fan performance itself deteriorates when the large obstruction is mounted in front of the fan [6]. In this case, the large obstruction affects the inlet flow to the fan and the fan performance itself may be deteriorated. In order to predict the correct supply flow rate regardless of the deterioration of the fan performance, the further investigation about the relationship between the obstruction near the fan and the fan performance should be additionally investigated.
Summary
In this article, the relationship between the supply flow rate of the axial fan in high-density packaging electronic equipment and the flow passage area is investigated experimentally by using the test enclosure. When the flow passage area in the enclosure becomes smaller than the fan’s flow area, the supply flow rate of the fan significantly decreases. In order to avoid the deterioration of the supply flow rate, flow passage area should be larger than the fan’s flow area. The obtained results may be used for estimating the supply flow rate of the fan easily in a design early stage.
For future study, an additional investigation of the pressure drop characteristic and the fan performance characteristic in high-density packaging electronic equipment may be meaningful in order to confirm the reproducibility of our results. Now, we are trying a development of detailed database of the pressure drop characteristic in high-density packaging electronic equipment. We will discuss whether our results can be applied regardless of the structure of electronic equipment. There is still room for developing methodology to apply our investigation to thermal design methods such as CFD analysis and flow and thermal resistance network analysis [9] in order to predict the supply flow rate of the fan in the enclosure rapidly and to shorten the thermal design period.
References
[1] The Japan Society of Mechanical Engineers, “JSME Data Book; Hydraulic Losses in Pipes and Ducts (in Japanese)”, (1979), 53-55, Maruzen.
[2] Fukue, T., Ishizuka, M., Nakagawa, S., Hatakeyama, T. and Koizumi, K., “Model for Predicting Performance of Cooling Fans for Thermal Design of Electronic Equipment (Modeling and Evaluation of Effects from Electronic Enclosure and Inlet Sizes)”, Heat Transfer – Asian Research, 40-4 (2011), 369-386.
[3] Nakamura, H., “Cooling Fan Model for Thermal Design of Compact Electronic Equipment (Improvement of Modeling using PQ Curve)”, Proceedings of the ASME InterPack ’09 (2009), Paper No. IPACK 2009–89010.
[4] Grimes, R., Davies, M., Punch, J., Dalton, T. and Cole, R., “modeling Electronic Cooling Axial Fan Flows”, Transactions of the ASME, Journal of Electronic Packaging, 123 (2001), pp. 112–119.
[5] Alič, G., Široc, B. and Hočevar, M., “Method for Modifying Axial Fan’s Guard Grill and its Impact on Operating Characteristics”, Forschung im Ingenieurwesen, 74-2 (2010), 87-98.
[6] Fukue, T., Ishizuka, M., Hatakeyama, T., Nakagawa, S. and Koizumi, K., “Study on P-Q Curves of Cooling Fans for Thermal Design of Electronic Equipment (Effects of Opening Position of Obstructions near a Fan)”, Proceedings of ASME-JSME-KSME Joint Fluids Engineering Conference 2011, Paper No. AJK2011-22054.
[7] Nakamura, H. and Igarashi, T., Development of Fan Performance Measurement Device (in Japanese), Research Report of the RC214 Research Project, 6.9 (2006), 805-812, The Japan Society of Mechanical Engineers.
[8] Japan Business Machine and Information System Industries Association, Acoustics – Method for the Measurement of Airborne Noise Emitted by Micro Fans, JBMS-72-2003 (2003).
[9] Fukue, T., Ishizuka, M., Nakagawa, S., Hatakeyama, T. and Nakayama, W., “Resistance Network Analysis of Airflow and Heat Transfer in a Thin Electronic Equipment Enclosure with a Localized Finned Heat Sink”, Proceedings of the 14th International Heat Transfer Conference, Paper No., IHTC14-22979.

