Bruce Guenin
Associate Technical Editor, Electronics Cooling

INTRODUCTION
The previous column, “Use of JEDEC Thermal Metrics in Calculating Chip Temperatures (without Attached Heat Sinks)” dealt with the application of JEDEC thermal metrics to IC packages that do not have heat sinks attached to them [1]. The methods are applicable to prediction of the junction temperature before the system is built and also to determining it from temperature measurements in the completed system.
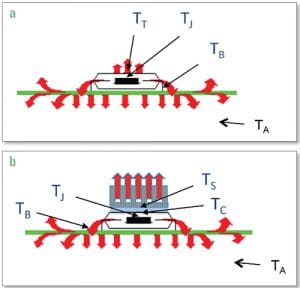
When no heat sink is attached to a package, in a typical system, the dissipated heat is removed from the package and its associate printed circuit board (PCB) by a convection process (either natural or forced) supplemented by radiation cooling. Since, typically the PCB has a much larger surface area than the top of the package, most of the heat flows to the air via the PCB, as illustrated in Figure 1a. The figure identifies the relevant temperatures and their location to be used for calculating the appropriate thermal metrics, as described in the previous column. These temperatures are measured at the following locations: incoming air (TA), package top center (TT), board (TB), and the junction (TJ).
However, when a heat sink is attached to the top of the package, it enhances the flow of heat from the top of the package to the air, as shown in Figure 1b. In addition to the temperature locations measured when no heat sink is present, the temperature on the bottom of the heat sink, TS, is also measured. Note that, when a heat sink is present, it is customary to refer to the temperature of the top center of the package as the case temperature (TC).

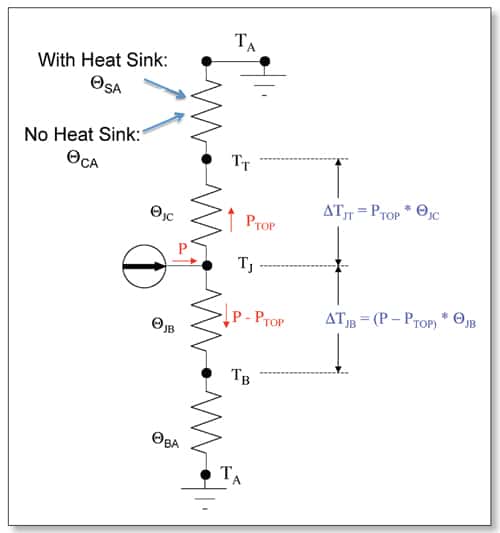
Figure 2 depicts a thermal resistance network representing the two primary heat flow paths. The upward path has two thermal resistances in series: QJC, the junction-to-case thermal resistance and a second one representing the heat flow path from the top of the package to the air. When no heat sink is present, this resistance is QCA , the case-to-air thermal resistance. When a heat sink is attached to the top of the package, then this resistance is represented by QSA, the sink-to-air thermal resistance.
The downward heat flow path also has two resistances in series: the junction-to-board thermal resistance, QJB, and the board-to-air thermal resistance, QBA .
Method of Calculating QJA with Heat Sink Attached
This column explores a method for predicting QJA, with a heat sink attached, using the metrics measured on the package without the heat sink attached (QJA, YJB, and YJT), the junction-to-case thermal resistance (QJC), and the sink-to-air thermal resistance (QSA), normally measured by the manufacturer.
Two different package configurations are evaluated: The first with two metal layers on the top and bottom surfaces of the package substrate. These are both signal layers. There are no metal planes. This nomenclature to describe this substrate stackup is: 2S0P. The second has two metal planes in addition to the two signal layers of the previous package. These planes provide much more efficient lateral spreading of heat than do the discontinuous signal layers. The stackup of this substrate is typically referred to as 2S2P. The thermal performance of the 2S2P package was studied in the previous column. Other details of the packages, test board, and heat sinks are provided in Table 1.

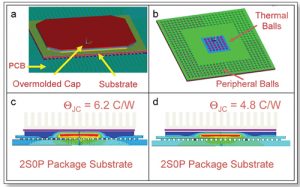
Figures 3a and 3b illustrate the construction of the package. Figure 3a shows a top view closeup of the package attached to a PCB. The substrate is shown with the overmolded cap covering the IC. When the heat sink contacts the package, it is pressed against the top surface of this cap. The cap is made of low-thermal-conductivity molding compound, which makes a significant contribution to the measured value of QJC . Figure 3b depicts the peripheral rows of solder balls that connect to the surface traces of the test board and the 6 x 6 array of thermal balls that are routed by vias to one of the two internal planes in the board to further enhance the thermal performance of the package. Figures 3c and 3d show the results of simulations of the QJC test with each of the two package configurations.

The temperature contours show clearly the superior heat spreading ability of the 2S2P substrate compared to that of the 2S0P one, leading to a lower value of QJC for the 2S2P package. [Note that the cooling effect of the heat sink was represented in the model by imposing a very large heat transfer coefficient on the top of the package (40,000 W/m2K). The heat sink was not explicitly included in the model.] These results were reprinted from a previous installment of this column, which provides an extensive discussion of their significance [2].
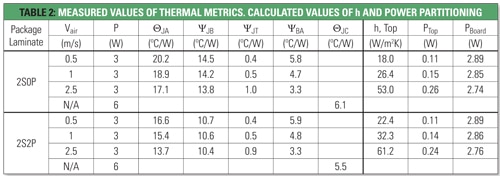
Table 2 lists all the package metrics measured for each of the two package configurations. Note that apart from QJA and QJC , all the other metrics are not thermal resistances, but the thermal characterization parameters, YJT, YJB, and YBA. Note that they have to converted into their equivalent thermal resistance values before they can be input into the thermal resistance network in Figure 2. This will then enable the calculation of QJA for the package with the heat sink attached. In order to be able to perform this conversion, one must know the actual power flowing along the upward path to the heat sink (PTop) and a separate value of power flowing to the PCB (PBoard).
The following equations may be used to calculate PTop and PBoard:
where h is the heat transfer coefficient on the top surface of the package, ADie is the area of the die, and ∆TTA is the temperature difference between the top of the package and the ambient air. It is assumed that most of the heat will flow to the top surface of the package directly from the die and a much smaller amount from the surrounding substrate.
The value of h can be calculated from the following expression, which is a rearrangement of terms of Eqn. 3 in the previous column [1]:
where kEMC and tEMC are the thermal conductivity and thickness above the die of the epoxy molding compound comprising the overmolded cap. Specific values of these parameters are provided in Table 1.
∆TTA can be calculated as follows:
Next, PBoard is calculated from:
Finally, any thermal characterization parameter (psi value) can converted into the equivalent thermal resistance (theta value) using the following relationship:
Thus, QJB = P·YJB / PBoard.
Results and Discussion
Table 2 presents all of the theta and psi value test results for the package without the heat sink attached. It also provides the calculated values of h, PTop, and PBoard. One notes that the measured values of QJC are close to the simulated ones. The calculated values of h are consistent with handbook values [3]. Also, it is notable that the heat out of the top of the package increases with air velocity and is less than 10% of the total in all cases. This is consistent with the image in Figure 1a, which depicts the board functioning as an extended fin to transfer most of the dissipated power to the air.
Table 3 lists all the thermal resistance values needed for input into the thermal resistance diagram of Figure 2. It includes the calculated values of QCA for the package without a heat sink. Note that the values of these resistances are quite high, owing to the very small area of heat exchange at the top of the package (~ 100 mm2). It is a very interesting contrast in the % of heat flowing out of the top of the package: no heat sink – 4%; with heat sink – 49-64%. The latter result would be expected since the thermal resistance for the up and down heat paths are nearly equal for the 6mm heat sink. For the 15 mm heat sink, the resistance for the up path is about 2/3 of that for the down path.
Table 4 lists the final calculated values of QJA for the situations in Table 3 and compares them to the actual test values. The calculated and test values for the packages without a heat sink are nearly equal. This is an simply an indicator that the arithmetic for these cases was correct. The results for the cases with the heat sinks are much more interesting. The model consistently predicts a value of QJA that is about 30% lower than the test value.
That there is such a large difference should not be much of a surprise. The model is explicitly based on the assumption that QJB is invariant, independent of the partitioning of the heat between the up and down paths. This is clearly not the case. As more heat is drawn out of the top of the package, more heat flux lines that had been flowing from the die to the board are diverted toward the top of the package. This would, essentially, leave a smaller number of flux lines flowing to the board. This modified path to the board would have a higher thermal resistance since the cross-sectional area of the metal participating in transmitting a smaller number of flux lines would be less, leading to a higher thermal resistance of this path.
It should be noted that the error is exacerbated by the fact that the up and down path thermal resistances are roughly comparable. If one of the resistances were dominant, then the error would be reduced.
A second effect is that the presence of the heat sink would divert the air flow from the top surface of the board downstream from the heat sink. This would reduce the effective heat transfer coefficient, leading to a higher QBA than that assumed in this model.
CONCLUSIONS
A method was demonstrated to integrate package-level and heat sink thermal measurement results in the calculation of the thermal performance of a package with the heat sink attached. The method has the benefit of being straightforward and intuitively satisfying. However, in the case explored here, the error was about 30% and overpredicted the final level of performance.
The fact that the competing heat flow paths were similar in magnitude exacerbated the error. Nonetheless, the user should be cognizant of the possibility of errors of this magnitude resulting from the use of thermal metrics that are not boundary-condition independent and exercise appropriate caution in interpreting the results.
The use of boundary-condition-independent thermal compact models involves more complexity. However, it is a much more robust method and is recommended for use in critical applications [4].
REFERENCES
- B. Guenin, “Use of JEDEC Thermal Metrics in Calculating Chip Temperatures (without Attached Heat Sinks),” ElectronicsCooling, Vol. 19, No. 4, December, 2013.
- B. Guenin, “A Funny Thing Happened On The Way To The Heatsink,” ElectronicsCooling, Vol. 11, No. 3, August, 2005.
- B. Guenin, “Convection and Radiation,” ElectronicsCooling, Vol. 4, No. 1, January, 1998.
- S. Shidore, “Compact Thermal Modeling in Electronics Design” ElectronicsCooling, Vol. 13, No. 2, May, 2007.


