By Victor Chiriac1, Steve Molloy1, Jon Anderson1, Ken Goodson2
1 Qualcomm Technologies, Inc., 2 Stanford Mechanical Engineering
Introduction
With smart phones and other mobile devices available in a variety of sizes and shapes, it is challenging to think in a consistent and comparative manner about the effectiveness of the thermal management solutions that they employ. This is growing more important as the mobile and wireless industries and associated research communities explore novel mobile cooling approaches. Here we define a universal thermal figure of merit – a dimensionless Coefficient of Thermal Spreading (CTS) – that can be calculated using either numerical simulations or Infrared (IR) surface temperature imaging and can be used to compare the thermal design effectiveness of many mobile devices and power levels. The proposed CTS Figure of Merit quantifies the effectiveness of heat spreading within the device by means of the uniformity of the surface temperature, and addresses a long-time need to quantify the thermal design effectiveness of various mobile devices which are skin temperature limited.
There has been past work on thermal performance metrics of electronics, particularly those for which central processing unit (CPU) overheating limits power generation. Some metrics are defined at the package level for single or multi-chip designs, and are useful for junction temperature prediction and as performance figures of merit [1, 2]. Other authors discuss the importance of the skin cooling and other thermal challenges in handheld mobile devices [3, 4]. However, when it comes to the system level thermal performance, the industry lacks a metric to quantify the “goodness” of the thermal design. A key benefit of such a metric would be to track the impact of design changes on the thermal performance considering the device skin limits.
One major thermal challenge of portable electronic devices is the strong spatial and temporal variability of the thermal boundary conditions at the case. A phone with outstanding internal thermal management will likely aim for a reasonably consistent temperature on its exterior surfaces. In fact, in the limit of perfect internal thermal management, all of the heat generated by the chips and other components inside the phone will be spread to the various phone surfaces and provide a nearly uniform temperature distribution when viewed from the outside. Figure 1 shows that selecting a good thermal management strategy inside the phone improves the temperature uniformity and lowers the peak surface temperature.
 |
|
| (a) | (b) |
Figure 1. Simulated temperature distributions on the surface of a generic phone LCD (138 mm x 70 mm) for two different thermal management schemes. (a) Large heat spreader (128 mm x 62 mm), which couples the battery with the heat generating chips and yields a more uniform temperature. (b) Smaller heat spreader (35 mm x 33 mm) yielding highly nonuniform LCD temperature.
Figure 1 illustrates that phone thermal design must meet certain skin limit temperatures and avoid the potential hot spots. The poor heat spreading on the device surface leads to a peak temperature of 59.5oC (Figure 1(b)), violating the 45oC skin temperature limit specifications set for the current design. By improving the thermal spreading, the peak temperature drops below the critical limit (Figure 1(a)).
The new proposed spreading metric is important both for thermal and electrical design/performance. At present, to meet the various performance specifications (skin/junction limit temperatures), the processors are throttled to reduce the power that leads to exceeding the limits. It is in the interest of the chip/device manufacturers to come up with a system level solution that will increase the overall electrical and thermal performance. This prompted the need for a heat spreading metric.
Defining the Coefficient of Thermal Spreading (CTS)
We define the specific figure of merit associated with the heat spreading efficiency, a metric which we will call the “Coefficient of Thermal Spreading” (CTS). This metric indicates that by designing towards improvements in the CTS, we can improve the heat spreading and enhance the power handling capacity of a given phone/mobile device, achieving higher performance.
Figure 1 suggests that the variation of the surface temperature is decreased as the thermal design quality improves. One strategy for defining the CTS would be to evaluate the standard deviation of the temperature about its average value, Tave. The maximum temperatures depicted for the two phone designs in Figure 1 suggest the following:
= (Tave-Tambient) / (Tmax-Tambient) (1)
Equation (1) is simply the ratio of the average temperature rise on the phone surface to the peak temperature rise. This ratio is dimensionless and increases to unity as the phone approaches a “perfect” thermal design, with uniform case temperature, for which Tave and Tmax are the same. In contrast to a metric based on the standard deviation, Equation (1) is directly related to power and maximum surface temperature, the key inputs/deliverables of the design process. Improving the CTS translates directly into a reduction of the maximum surface temperature for a given power.
To develop a quantitative metric, it is a useful to assume a constant value of the convective heat transfer coefficient, h, over the entire surface, in part because the local heat transfer rate varies due to a variety of external parameters. Equation (2) shows that for a given power and surface area, the average surface temperature is independent of the phone design. A poorly designed phone has hot/cold regions, but the average surface temperature is the same as of a well designed phone, assuming equal power generation and surface area for both devices.
where Pphone [W] is the total heat generated in the phone; A is the total surface area, and qave = Tave – Tambient is the average phone surface temperature rise relative to the ambient air.
There is another way to calculate the CTS, which may be more straightforward depending on what information is available. Making use of Equation (2), we calculate the CTS using:
where Pphone is the power generated without rising above the case temperature limit and “Pperfect/ideal” is the power removed from a phone with perfect internal spreading.
Equation (3) is useful for extracting the CTS from infrared imaging data, which can provide a solid estimate of the maximum temperature rise.
Measuring the CTS
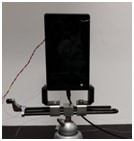
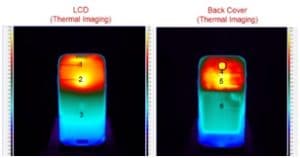
IR imaging was performed to gain understanding of the CTS metric. The benchmark use case is Quad-Dhrystone and the device is in vertical orientation (Figure 2(a)). Test details/equipment: a) K-type thermocouple measures the ambient temperature; b) data logger records the thermocouples temperatures; c) IR camera measures the LCD/Back Cover peak/average temperatures; d) Wait 40 mins until surface temperatures reach steady-state, start CTS measurement.
 |
 |
|
(a) Test set up |
(b) Measured IR thermographs |
Note Thermocouple locations 1 to 6 defined in (b).
Figure 2. IR imaging of commercial phone.
Since the surface emissivity of LCD/back cover is unknown, three K-type thermocouples (designated as 1 through 6, three on each LCD/Back cover surface) were mounted at low/medium/high-temperature zones at LCD/Back cover (Figure 2(b)). The thermocouple readings were used as the reference temperature to calibrate the emissivity of the LCD/Back cover surfaces. The surface emissivity setting of the IR camera is adjusted until the temperature difference between the thermocouple and IR camera reading is less than 1°C. The determined surface emissivity is the emissivity of the LCD/Back cover surface.
There is potential for further reduction in the tests variability (due to the open air environment) by using JEDEC closed box [5], with modified port for IR camera access. This deserves further evaluation, in case the industry is moving towards the CTS concept adoption.
To capture the temperature profiles: a) Run power intensive use case; b) Capture the surface temperature using IR camera; c) Port the IR temperature data into .csv file; d) Do an area weighted average of the surface temperatures for the display/case surfaces; e) Extract the overall device skin maximum temperature;
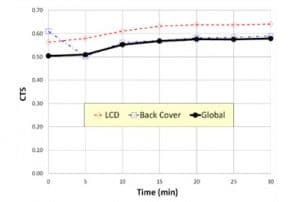
f) Calculate Figure 3 summarizes the CTS measurement over 30 minute: CTS peaks at 0.62 for this specific device.
Figure 3. Calculated Coefficient of Thermal Spreading extracted experimentally for commercial phone
Example Applications of the Coefficient of Thermal Spreading (CTS)
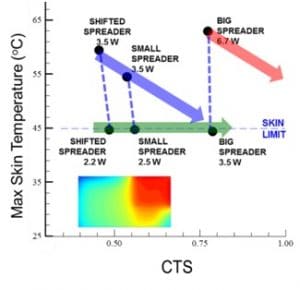
We expect the CTS to guide the design improvements and interactions with the phone/mobile manufacturers/companies. We completed several simulation/CFD studies of phone design incorporating differing spreader geometries, at various powers. Figure 4 plots the simulated maximum surface temperatures as a function of heat spreader geometry and power.
Figure 4. Maximum skin temperature versus CTS. Note: (i) The phone designs along the green arrow are limited by skin temperature, with power chosen specifically to meet that limit. (ii) The designs along the blue arrow show what happens to the skin temperature, for a constant given power, through improved thermal design. (iii) The red arrow suggests that it is impossible to improve a design sufficiently to cool very large power loads.
For a phone that is cooled sufficiently well, increasing the CTS guides to higher power capacity without overheating the case. In Figure 4, the green arrow draws attention to three successive simulations for increasing spreader size that allow the power to be increased from 2.2 to 3.5 W without overheating the skin. Larger spreaders allow the CTS to increase from 0.5 to 0.8. By increasing the CTS of a device from 0.5 to 0.8, there is over 1.2W Power benefit and the skin limit stays at 45oC.
For problem phone designs (device skin is too hot), increasing the CTS should guide to a working design, or to the conclusion that the power is unmanageable. The blue arrow in Figure 4 draws attention to three successive simulations at 3.5W constant power, for which increasing the spreader size (thus increasing the CTS) drops the maximum skin temperature from ~ 60oC to the required 45oC limit.
For the case of 6.7W and the big spreader, the red arrow suggests that the CTS needs to be increased above unity to function properly. This is impossible, as the CTS reaches a maximum of one for a perfect/isothermal case, meaning that power reductions will be essential. For that specific device platform, the maximum power using an ideal CTS is limited to 3.8W.
Finally, the CTS is a figure of merit for the design geometries/materials, and should be independent of the power level for the given use case/s. The dashed blue lines in Figure 4 show that, for a given spreader dimension, the CTS is essentially independent of the phone power. The dashed lines are not perfectly vertical because of the slight temperature dependence of the thermal properties.
Although the CTS is power independent for specific use case/s, the CTS does vary with time. If Equation (1) is evaluated as a function of time, while the device is heating up, the CTS evolves with time and approaches higher degree of uniformity in steady state. The CTS remains largely independent of power levels, although this can become more complicated if the power is time varying as well.
Quantitative Design Targets using the CTS
The CTS is a powerful tool as it enables the best performing mobile/portable electronic devices. Chip manufacturers can define a minimally acceptable CTS level to ensure that their chips are cooled appropriately and deliver a level of performance that customers will find compelling/favorable. While all companies should strive for a CTS approaching unity (the perfectly cooled phone/mobile), eventually the costs associated with internal thermal management may become excessive. With improvements in thermal technologies, the higher CTS/performance devices should increase.
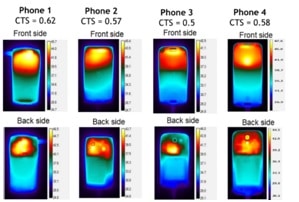
Figure 5. Measured IR temperature surface thermographs and CTS values for several commercial phones. CTS calculated using Equation (3) and the infrared imaging data. The temperature scale is different for each phone.
Our internal thermometry work has evaluated CTS values from 0.5 to 0.62 for various commercial phones (Figure 5): these numbers are critical because they translate directly into allowable internal power generation levels. By encouraging the phone manufacturers to increase the CTS to higher levels – our simulations suggest 0.8 – it is possible to achieve better balance between performance and cost.
Why is the CTS Important?
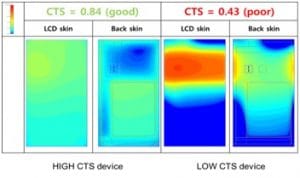
The increased CTS leads to better heat transfer and reduced peak temperature at the phone surface. As the internal spreading improves (CTS from 0.43 to 0.84), the device skin temperatures drop below the critical values (no hot spot) and a smaller temperature gradient occurs across the device surface/s (Figure 6). The high CTS device dissipates an extra 1.2W before it violates the skin limits compared to the design with low spreading efficiency (CTS = 0.43).
Figure 6. Comparison of calculated CTS values for poorly designed (CTS = 0.43) versus well designed (CTS = 0.84) devices: hot spot evident on poorly designed vs well spread heat on well designed phone skins. Note: CTS calculated using Equation (1) with average/peak skin temperatures from simulations. The temperature scale is the same.
For the specific device tested/simulated: every 1°C skin temperature difference leads to 0.16 W change in power, and is achieved by reducing CTS by 0.03.
How can we Improve the CTS?
To enhance the mobile device heat spreading (CTS): a) Optimize the PCB ground plane; b) Use larger copper content for solid ground plane layer; c) Connect all ground pins of key ICs directly to this layer; d) Separate hottest ICs; d) No high Power ICs overlap on opposite PCB sides; e) Place connectors on opposite sides of key ICs where possible.
Alternative CTS Formulations?
The authors evaluated alternative CTS formulations: a) Tavg/ T_max; b) Tmax/T_ideal; c) T_ideal/Tmax; d) T_ideal_system/T_real_system. Due to the lack of a physical meaning or independence on ambient Temperatures, it was decided to select the most appropriate version, as defined by Equation (1).
Concluding Remarks
This article proposes a new, dimensionless thermal spreading effectiveness metric for mobile devices, named CTS (Coefficient of Thermal Spreading). The CTS value quantifies the internal thermal spreading of mobile devices, and is a specific metric to improve the thermal design. It indicates how much a given mobile device can be improved for the given shape/size/form factor. As shown by simulations, optimally designed phones could reach CTS values between 0.8 and 0.9, while poorly balanced phones have CTS values below 0.5. Different mobile devices have different CTS values depending on overall size and internal design. CTS metric is used to help improve the thermal spreading over the device surface and reduce the skin maximum temperature. If adopted by the industry, the CTS Figure of Merit will lead to more thermally balanced phones/mobile devices.
Acknowledgement:
The authors appreciate the help of Qualcomm San Diego team members: Luis Rosales performed the simulations, while Peng Wang took the thermometry data. Many other people provided valuable feedback and expertise.
References
- Guenin, B., “Toward A Thermal Figure Of Merit For Multi-Chip Packages” Electronics Cooling, Vol. 12, No. 4, November, 2006.
- JEDEC document JESD51-12, “Guidelines for Reporting and Using Electronic Package Thermal Information.” Available for download at jedec.org.
- Mongia, R., Bhattacharyab, A., and Pokharna, H., “Skin Cooling and Other Challenges in Future Mobile Form Factor Computing Devices”, Microelectronics Journal, Vol. 39, pp. 992 – 1000, 2008.
- Lee, J., Gerlach, D.W., Joshi, Y.K., “Parametric Thermal Modeling of Heat Transfer in Handheld Electronic Devices”, Proceedings of the 11th Intersociety Conference on Thermal and Thermomechanical Phenomena in Electronic Systems (ITHERM 2008), pp 604-609, 2008
- JEDEC document JESD51-2A, “Integrated Circuits Thermal Test Method Environmental Conditions – Natural Convection (Still Air).” Available for download at jedec.org

