Pouya Asrar *, Xuchen Zhang, Craig E. Green, Peter A. Kottke, Thomas E. Sarvey, Andrei Fedorov, Muhannad S. Bakir, and Yogendra K. Joshi*
Introduction
Two phase cooling has become a promising technique for managing high heat fluxes from electronic packages such as 3D stacked chips. Flow boiling in microchannel arrays has been employed in many applications[1-3], and boiling regimes in different shapes of microchannels have been investigated[4,5]. In this article we have visualized the flow boiling of refrigerant R245fa in a different configuration of a pin fin enhanced microgap, which allows spanwise fluid movement for improved vapor management, as well as 3D electrical connectivity via the pins, to cool a footprint area of 1 cm x 1cm. The overall design of the pin fin test unit and the pin fin array dimensions are provided in Figure 2.
The working fluid used in this investigation, R245fa, has a much lower operational pressure compared to other refrigerants. Its charging pressure is 122 kPa at 20 °C, compared to 572 kPa for R134a at the same temperature. Also, the saturation temperature is within a reasonable range (15 °C to 85 °C) for thermal management of Si microelectronics.
Experimental system and methods
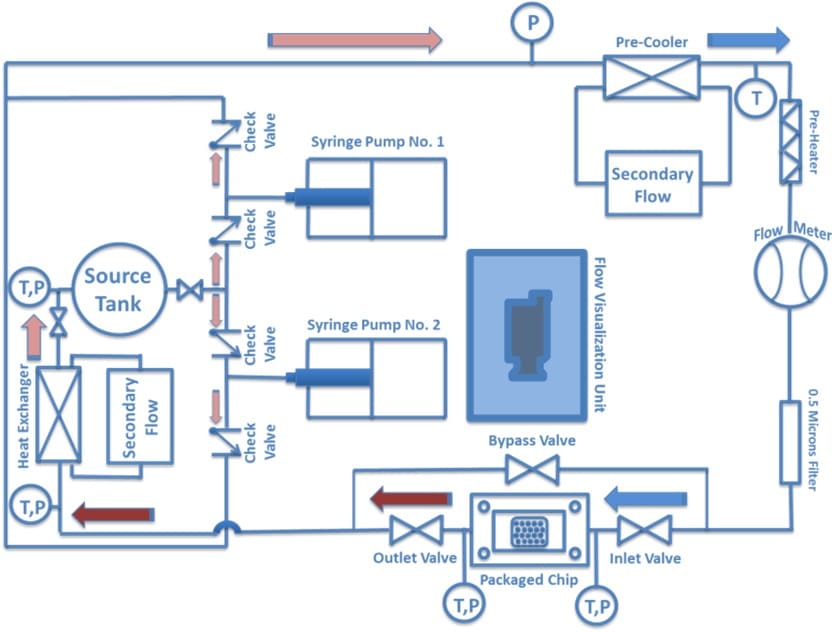
Figure 1 demonstrates the schematic of the experimental setup. Before charging the system, the loop is evacuated using a vacuum pump[6]. As the next step, the source tank is warmed up to a temperature higher than room temperature to a typical value of 28 °C. A 1,000 mL reservoir is then charged with enough refrigerant before charging the rest of the system. In order to ensure that the syringes are fully charged, the reservoir is heated up to few °C higher than ambient temperature. Continuous flow becomes possible by having one of the pumps infusing, and the other one withdrawing simultaneously. After charging the pumps, the working fluid is pushed by one syringe pump towards the pre-cooler in the system in order to insure its liquid phase. The refrigerant passes through a microturbine flow meter[7]. R245fa is maintained contaminant-free by incorporating a 0.5 μm in-line filter[8]. It passes through a heat exchanger[9] before returning back to the 1000 mL reservoir.
Steady state conditions are insured by running the system for a few hours, when variations are within 0.25% for pressure, and 0.5 °C for temperature in each pushing cycle. The heaters are then gradually powered at each heat flux, and all measurements are archived. Flow visualization is performed using a high speed camera[10] at 2,229 frames per second.
Fig. 1. Flow Loop Schematic
Fabrication Process
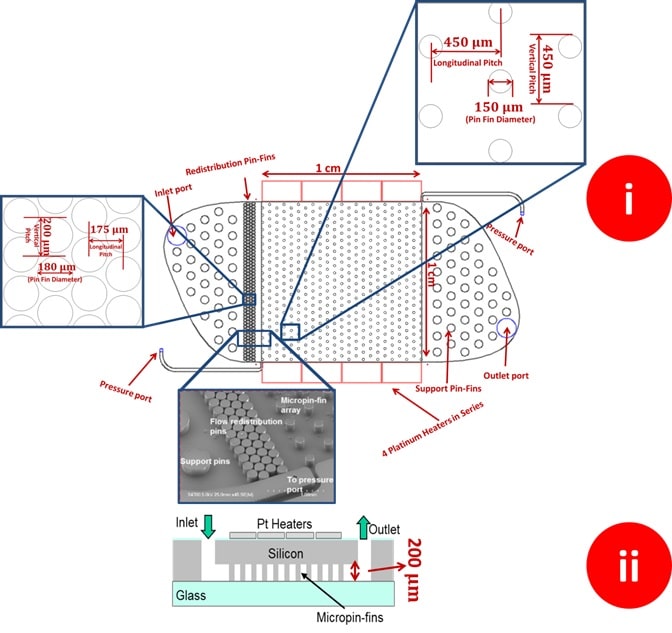
The 200 μm tall microgap consists of a 1 cm x 1 cm array of staggered cylindrical micropin-fins, as shown in figure 2i. The diameter and pitches of the micropin-fins are shown in Fig. 2i. Pressure ports are included on both sides of the micropin-fin array in order to accurately measure the pressure drop. Large mechanical support pins with diameter of 500 are added near the inlet and outlet to improve structural strength. Four serpentine platinum heaters/resistance temperature detectors (RTDs) with a thickness of 200 nm generate heat load and provide temperature measurements in four sections along the flow length (between inlet and outlet).
The fabrication process begins with the etching of the micropin-fins, followed by an anodic bonding of a glass lid to encapsulate the microgap. Next, the Platinum heaters are deposited on the silicon side. Finally, inlet, outlet and pressure ports are etched. The detailed fabrication process can be found in [11]. A cross-sectional schematic of the sample is shown in Fig. 2 ii.
Fig. 2. SEM Picture of the Device (i) and the Fabrication Steps (ii)
Results and Discussion
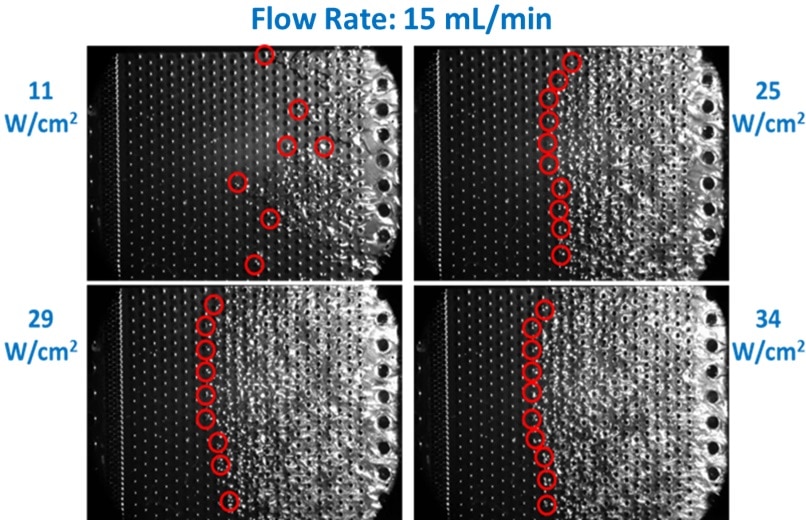
Starting from a small power (~ 1 W) applied to all four heaters; the power was increased gradually until two phase flow was observed in the microgap. The flow boiling first occurred near the exit of the microgap, and upon increasing the heat flux progressed towards the inlet. Figure 3 presents visualizations of the flow boiling for heat fluxes ranging from 11 W/cm2 to 34 W/cm2. Two phase flow started via nucleate boiling. Small bubbles were formed around pin-fins in the microgap, and grew as they moved towards the outlet. As shown in figure 3, for heat fluxes of 25 W/cm2 and above, the two phase region is evenly distributed over the microgap. This area progressed towards the inlet of the chip, as the heat flux increased. The red circles in figure 3 identify the spots where the nucleation was observed around single pin fins. The nucleate boiling occurred at the first column of pin fins of the two phase area in the microgap.
Fig. 3. Flow Visualization Recorded with High Speed Camera
at indicated values of heat flux
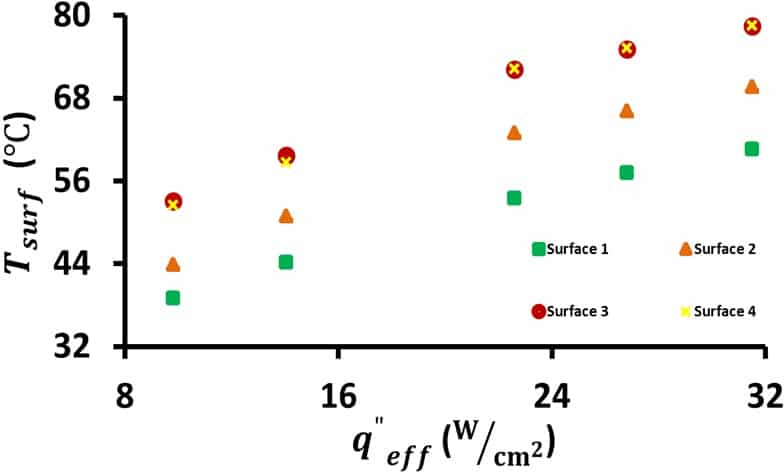
A 1D heat conduction model was used to calculate the surface temperature at the interface with the refrigerant, corresponding to each heater temperature.Figure 4 illustrates the surface temperatures at all four heaters locations on the back of the chip. Heater 4 (closest to the outlet of the flow) showed the maximum surface temperature among all four heaters, whereas for heat fluxes above 25 W/cm2, heater 3 had the maximum temperature.
Fig. 4. Surface Temperature Distribution
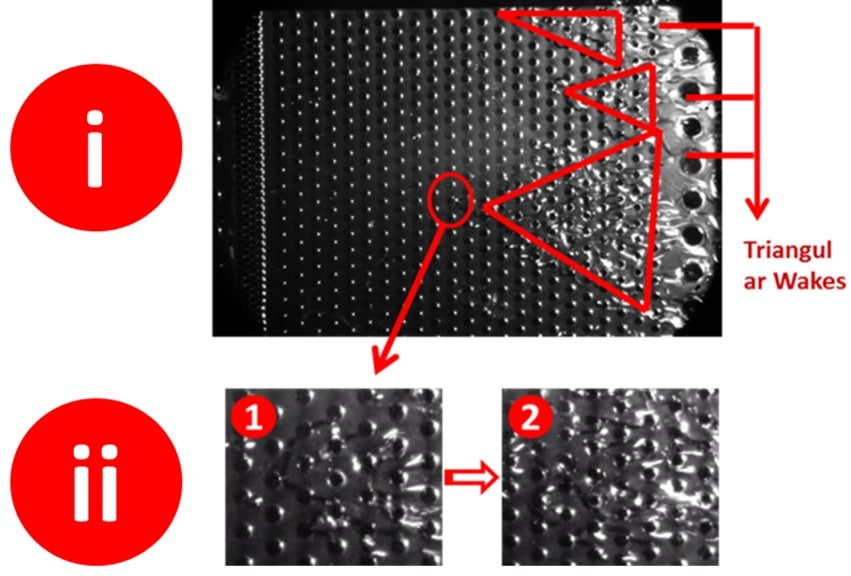
Figure 5 demonstrates the visualizations for heat flux of 11 W/cm2 in more detail. Figure 5i clearly shows the triangular two phase wakes initiating at few locations along the pin fin array. This wake structure demonstrates the rapid spanwise spreading of bubbles generated around individual pin fins, as also observed by Isaacs et al.[8]. Figure 5ii illustrates the flow boiling on a particular part of the gap at two different time frames. The first picture relates to the initiation of the bubbles around the pin fins, whereas the second clearly shows that a larger volume of vapor has covered the pin fins in the microgap, because of evolution of two phase region with respect to time.
Fig. 5. Triangle-Shaped Liquid/Vapor Wakes Happening at
11 W/cm2 (i), Close-Up at the Nucleation Zone (ii)
Ii-1: initial nucleation of bubbles
Ii-2: fully developed bubble production
Conclusions
A simultaneous visualization and thermal measurement study was performed on two phase flow of refrigerant R245fa in a test device having a microgap equipped with circular pin fins arranged in a relatively large footprint area of 1 cm x 1 cm. The heat flux ranged from 7 W/cm2 to 34 W/cm2. The nucleation zones around individual pin fins were visualized using a high speed camera. A maximum vapor quality of about 30% was calculated at the outlet of the test device. The enhanced microgap configuration offers a promising approach for two-phase thermal management of stacked chips.
Acknowledgments
The authors thank the DARPA IceCool Fundamentals Program for providing the financial support for this research.
References
1. D. Bogojevic, K. Sefiane, A.J. Walton, H. Lin, G. Cummins, D.B.R. Kenning, T.G. Karayiannis, “Experimental investigation of non-uniform heating effect on flow boiling instabilities in a microchannel-based heat sink”, International Journal of Thermal Sciences Vol. 50, pp. 309-324, 2010.
2. Chun Ting Lu and Chin Pan, “A highly stable microchannel heat sink for convective boiling”, Journal of Micromechanics and Microengineering, Vol. 19, No. 5, p. 055013, 2009.
3. Ayman Megahed, “Experimental investigation of flow boiling characteristics in a cross-linked microchannel heat sink”, International Journal of Multiphase Flow, Vol. 37, pp. 380-393, 2010.
4. Tzu-Hsiang Yen, Masahiro Shoji, Fumio Takemura, Yuji Suzuki, Nobuhide Kasagi. “Visualization of convective boiling heat transfer in single microchannels with different shaped cross-sections”, International Journal of Heat and Mass Transfer, Vol. 49, pp. 3884-3894, 2006.
5. D. Bogojevic, K. Sefiane, G. Duursma, A.J. Walton, “Bubble dynamics and flow boiling instabilities in microchannels”, International Journal of Heat and Mass Transfer, Vol. 58, pp. 663-675, 2013.
6. Vacuum pump model VN-200N, JB Industries Inc.
7. Flow meter model S-114, McMillan Co.
8. In-line filter model SS-4F-05, Swagelok Co.
9. Heat exchanger model LL510G14, Lytron Co.
10. High speed camera model Phantom V211, VISION Research Co.
11. Pouya Asrar, Xuchen Zhang, Craig E. Green, Peter A. Kottle, Thomas E. Sarvey, Andrei Fedorov, Muhanned S. Bakir, and Yogendra K. Joshi, “Flow Visualization of Two Phase Flow of R245fa In a Microgap with Integrated Staggered Pin Fins”, IEEE SEMI-THERM 32, March 2016.

