Husam Alissa, Kourosh Nemati, Dr. Bahgat Sammakia,
Mark Seymour, Ken Schneebeli, Dr. Demetriou
New Solutions, New Challenges
Generally, a legacy data center consists of an array of hot and cold aisles where the air intake to the IT equipment resides in the cold aisle and the air exhaust of the equipment rejects hot air into the hot aisle. In a raised floor environment, chilled air is supplied through the plenum to the cold aisle. The heated air in the hot aisle flow backs to the cooling unit return as shown in Fig. 1 (a). However, the recirculation of air from hot to cold aisles or vice versa is a common occurrence. This air recirculation endangers the well-being of servers and reduces data center cooling efficiency, resulting in an increased TCO. To resolve these issues cold or hot aisle containment (CAC or HAC) solutions were introduced to segregate the incoming cold air stream from the heated exhaust stream as shown in Fig. 1 (b & c). CAC or HAC cooling solutions allow higher chilled set point temperature and can enhance the performance of an air side economizer, which admits outside air to the cool air stream (when outside temperatures are low enough).
This segregation of the hot and cold air streams is referred to as containment. It is considered to be a key cooling solution in today’s mission critical data centers. It promotes:
- Greater energy efficiency: by allowing cooling at higher set points, increasing the annual economizer hours and reducing chiller costs.
- Better use of the cold air and hence greater capacity: containment generates a higher temperature difference across the cooling unit making the most of the cooling coils capacity.
- Less likelihood of recirculation so better resiliency (defined as the ability of a data center, to continue operating and recover quickly when experiencing a loss of cooling)
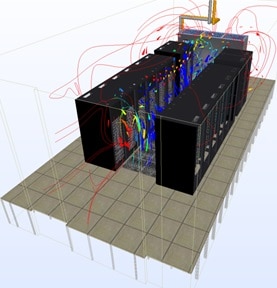
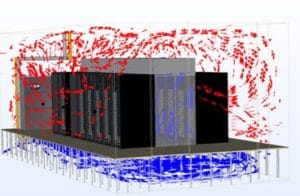
Fig. 1. Schematic of (a) Legacy Open Hot Aisle-Cold Aisle (HA/CA) (b) Cold Aisle Containment (CAC) and (c) Hot Aisle Containment (HAC). [1]
However, hot or cold aisle air containment (CAC or HAC) creates a new relationship between the IT air systems and the airflow supply source. In the legacy open air data center, each IT equipment is able to get its necessary airflow (i.e. free delivery airflow), independent of airflow through the other neighboring IT equipment, and also independent of airflow through the perforated tiles through the full range of air system fan speeds (i.e., varying RPM).
To describe the potential issues with the containment, the design of a CAC system installed on a raised floor similar to Fig. 1 (b) is explained. Other containment solutions will have analogous exposures. The CAC solution is constructed such that the cold aisle is boxed to segregate the cold aisle from the rest of the data center. Airflow leakage paths through the CAC are minimized by the design. The result is that airflow for the IT equipment is delivered through the raised floor perforated tiles within the CAC. This causes a new airflow relationship between all the IT equipment enclosed by the CAC. There is no longer an unlimited supply of low impedance airflow from the open air room for all the IT equipment within the CAC. Instead, there is effectively a single source of constrained airflow through the perforated tiles. All of the IT equipment air systems are operating in parallel with each other and are all in series with the perforated tiles. As a result, the air systems for all the IT equipment will compete with each other when the airflow in the CAC through the perforated tiles is less than the summation of the IT equipment free delivery (FD) airflows. It can now be understood that different IT equipment will receive differing percentages of their design FD airflow, depending on the differing performance of each IT equipment air system when they are competing in parallel for a constrained air supply.
Currently, there is a lack of IT equipment airflow data in the available literature. Such data is crucial to operate the data centers in which there is a perpetual deployment of containment solutions. Note that IT equipment thermal compliance is based on an implicit assumption of a guaranteed free delivery airflow intake. However, the airflow mismatches and imbalances can occur due to one or more of the following reasons: inherent variable utilization of the IT equipment; the practice of increasing set points to save energy; load balancing and virtualization; IT equipment with differing air flow capacity stacked in the same containment; redundant or total cooling failure; air filters derating with time; environmental changes during free cooling; maintenance of redundant power lines; initial airflow assumptions at the design stage; presence of physical obstruction at airflow vents; or rack/IT specific reasons ( e.g. side intake vents in a narrow rack). For these reasons, understanding the IT airflow demand based on load and utilization becomes vital.
Generic Method to Characterize IT Air Systems
For physical illustration, we will use a CAC scenario as an example. Fig. 2 (a) shows the active flow curve (AFC) for a generic piece of IT equipment, where the pressure is measured at both the inlet and outlet [3]. Again, referring to a CAC scenario, the inlet or P1 is in the contained cold aisle. The outlet P2 is measured at the open hot aisle side. Obviously, the chassis is designed to pull cold air from the cold to the hot aisles (i.e. Regular Flow). From an aerodynamic point of view, the flow curve includes three regions of airflow that an operating server can experience.
Region 1 represents aided airflow. An example can be an over-provisioned CAC where P2 < P1. This will induce airflow rates that are higher than the free delivery or designed airflow through the IT. Any operating point in this region has a negative backpressure differential based on the definition of ∆P and a flow rate that is always higher than point FD. The IT is said to be at free delivery (FD) or design airflow when the backpressure differential is equal to zero P2 – P1= 0. This is analogous to an open aisle configuration, where the cold and hot aisle pressures are equal, or even a CAC scenario with neutral provisioning and an ideally uniform pressure distribution. Note that the FD point is implicitly assumed by IT vendors when addressing thermal specifications. However, the designed airflow may not be the actual operating condition in a containment environment. Therefore, both the inlet temperature and flow rate should be specified for IT, especially when installed with a containment solution. This becomes of great importance when the supply temperature is increased for efficiency, inducing variations in the server’s fan speeds. In region 2, the airflow of the IT is lower than the free delivery. This can be explained by an under-provisioned CAC situation where P2 > P1, hence, the positive backpressure differentials. As the differential increases, the airflow drops until reaching the critical pressure point at which P2 – P1= PC, after which the IT fans are incapable of pulling air through the system and into the hot aisle (airflow stagnation). Both points FD and PC are unique properties of any IT equipment and are important to be identified by IT vendor specifications.
If the backpressure differential exceeds the critical pressure, P2 – P1> PC, then the system moves into region 3 in which the airflow is reversed which means that the backpressure is high enough to overcome the fans and induce back airflow from hot to cold aisles through the IT chassis. This irregular flow behavior occurs when placing IT equipment with different air flow capabilities in the same containment [3, 4]. Generally speaking, IT equipment reliability and availability are exposed to increased risk in both regions 2 and 3. Fig. 2 (b) shows the AFC for a 2U-New Generation (NG) server at maximum fan speed. In normal operation the server operates at 20% of the maximum speed. This means that the critical pressure is 12 Pa only during normal operation, following the affinity laws [7]. Similarly, the airflow demand during normal operation of this server is ~0.014 m3/s (30 CFM). The point of emphasis here is that at certain events in the data center the IT equipment airflow demand might increase by 2-3 times.
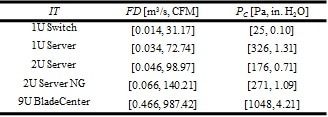
In short, the AFC testing process [3] is based on attaching operating servers at controlled fan speed to the flow bench and creating different imbalances that covers the three regions of airflow. The procedure was applied to five different IT chassis that cover the airflow spectrum in the data center. Note that the fans are operated at maximum RPM, but curves at lower RPM can be derived from affinity laws. Table 1 displays the main characteristic of each air system [3]. A 1U TOR (top of rack) switch represents the low end of the airflow spectrum (i.e. weak air system). The critical pressure is at 25 Pa (0.10 in. H2O) and the free delivery is 0.014 m3/s (31.17 CFM). A 9U BladeCenter has a free delivery airflow of 0.466 m3/s (987.42 CFM) and the critical pressure is 1048 Pa (4.21 in. H2O). It is clear that the BladeCenter has the strongest air system when compared with all other IT equipment characterized. The importance of Table 1 is that it shows that during an airflow shortage event, the different pieces of IT equipment react differently, based on the relative strength of their air moving system. This indicates that some will fail or overheat before others do.
TABLE 1
IT AIR SYSTEMS CHARACTERISTICS
Impacts on Processing and Storage Components
A. Impact on CPU: A 2U compute server was connected through a Linux interface where the CPU utilization and the fans’ RPM were controlled while mounted on the flow bench. The AFC (Active Flow Curve) experimental procedure was implemented at maximum fan speed and 100% CPU utilization. As the backpressure was varied, steady state temperature readings were taken for the CPU, as shown in Fig. 3. The testing started at region 1 where the server was over-provisioned with airflow higher than its design airflow rate.
As aiding to air flow is reduced and the pressure values move from negative to zero at which the flow rate is at free delivery (FD). A very subtle increase in the CPU temperature is noted (50-52 °C). Increasing the backpressure further leads to flow region 2 in which CPU temperature starts to increase significantly since the airflow is lower than designed although inlet temperature is maintained at 20 °C, so concerns with IT reliability begin upon entering region 2. The backpressure is increased furthermore to reach PC. At this point the CPU temperature reaches the maximum value since airflow is near zero through the server. Therefore, heat transfer via forced convection is minimized and the package is primarily relying on conduction, an inefficient heat removal mechanism. At that point the CPU has started to drop in voltage and frequency to reduce the heat flux, resulting in a loss of computational performance. Finally, as the flow curve moves into region 3, reverse airflow takes place. The system cools again due to forced convection. However, in a real-life case (not wind tunnel test) the rear of the server is in a hot aisle environment that is usually maintained at a high temperature to gain efficiency. This hot air will recirculate back into the contained aisle and cause issues for the surrounding IT.
It is important to note that for acoustics and energy budget reasons, IT equipment usually operate at the low end of their air system’s capacity. This implies that much lower external impedances are sufficient to cause problems.
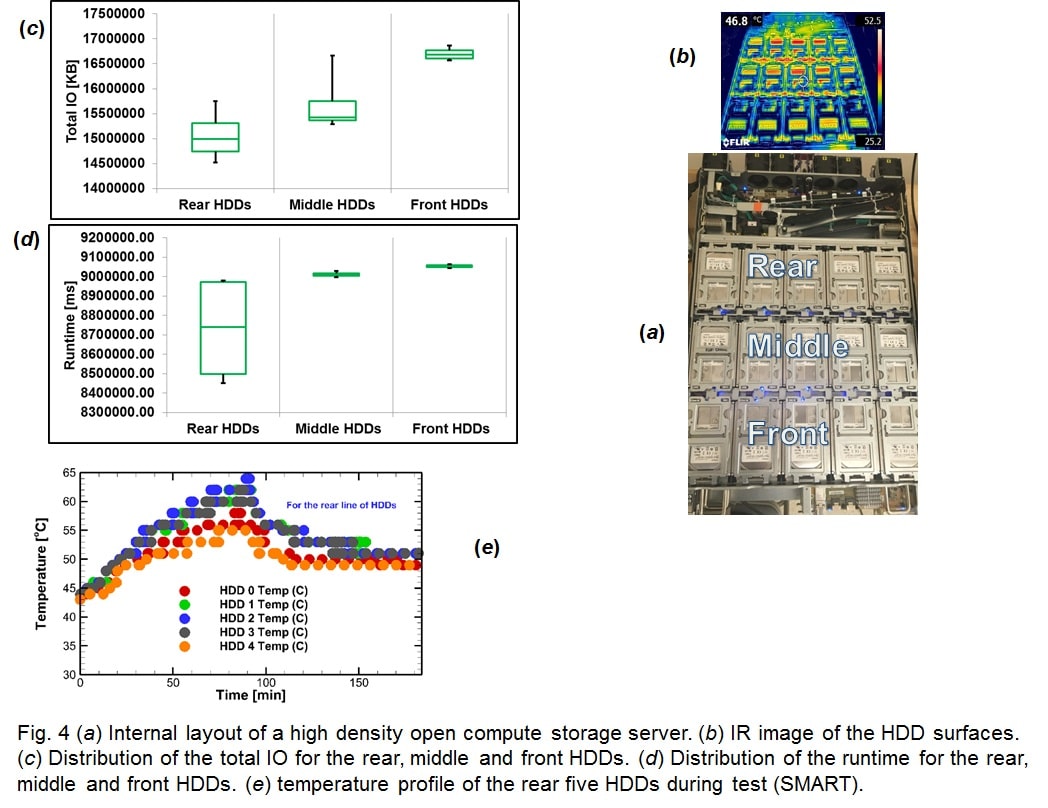
B. Impact on HDD: To understand the effect of subtler airflow mismatches that can happen during normal operation, a back pressure of ~30 Pa (equal to the critical pressure) is applied to an open compute high density storage unit [5]. This is a longer duration transient test during which the response of the storage system is observed under a read/write job condition. In this test, no fan speed constraints were applied. This allows for observing the actual response of the hardware fans’ algorithm. The test starts while the chassis is operating at its free delivery airflow with zero external impedance. Then a back pressure perturbation is introduced for ~70 minutes after that the system is relived. During this period the HDDs (Hard Disk Drives) heat up as shown in the thermal image. The FCS (fan control system) responds to that by increasing the fans’ speed. After that, the external impedance is removed, the unit is allowed to recover and the RPM gradually drops to initial value. The storage unit has three rows of HDDs¬—front, middle, and rear—as shown in Fig. 4(a). Fig. 4(b) shows an IR image of these components during operation. It can be seen that the rear HDDs can get thermally shadowed by the heat generated by the upstream components.
Bandwidth and IO are correlated to the thermal performance. The total IO is shown in Fig. 4 (c) for the HDDs. It can be deduced that the rear HDDs, which are towards the back of the drawer, are generally observed to have a lower total IO due to thermal preheating by the upstream HDDs and components. The total IO reduction will accumulate to yield bigger differences over longer time intervals. The runtime displays the time interval during which the HDDs are performing a read or write command/request. When the HDDs start to overheat they also start to throttle (processing speed slows down as temperature increases) requests to write or read which explains the reduction in the runtime of the rear thermally shadowed HDDs as shown in Fig. 4(d). The correlation between the data transfer and thermal performance can be further understood by looking at Fig. 4(e) where the temperatures are reported for the five HDDs at the rear during the test. This increase in temperature is a result of the airflow imbalance that ultimately affects the IO and runtime.
Implications on Monitoring and Control
The cooling control scheme of the recent data center can be based on Infrastructural temperature monitoring points at the IT inlets or, alternatively, at locations specified for the IT analytics Intelligent Platform Management Interface (IPMI) data. These locations include ones within the equipment but near the air inlet. Usually, the IPMI inlet sensor reads a couple of degrees higher than the Infrastructural sensors due to preheating from components inside the chassis. However the inconsistency rapidly grows between both measuring systems during airflow imbalances such as those experienced in containment. Fig. 5 shows measurements taken for three servers in a mid-aisle rack during a blower failure experiment that starts at t=24 minutes in a CAC environment [6]. During such a scenario the IPMI data is significantly affected by the servers’ internal heating. On the other hand, the Infrastructural sensors are only reporting on the ambient air temperature. It would take ~ 35 minutes for the first server to hit 34 °C using Infrastructural sensors but only 9 minutes based on the IPMI reading. This happens because the IPMI sensors are closer to the hardware and are more affected by hardware temperature increase resulting from airflow reduction.
Concluding Remarks
This article discussed the interaction between the data center and the IT when air containment is deployed. It was shown that it is vital for the data center safe operation to be aware of the dynamic airflow response of the IT and their interaction with the data center. As we are steadily moving towards the cloud data center, a chip to facility thinking is important. Based on the discussions above, the following can be suggested to reduce risk of airflow imbalances:
1- Always utilize pressure controlled cooling units—not only inlet temperature-based—to control the contained data center cooling.
2- Utilize pressure relief mechanisms such as automatically opened doors during power outages in containment.
3- Design the cooling system (CRAH, CRAC, Fans wall…) to be able to deliver the maximum airflow demand of IT. This will be of even greater importance when the containment is used in a free cooling scheme.
4- Consider the impact of the air system differences between the IT stacked in containment.
5- Utilize the difference between IPMI and Infrastructural sensors as an early alarm of overheating.
6- Possible airflow mismatches in containment (due to failures, virtualization and varying loads…) require further availability and reliability guidelines to be incorporated with the current ASHRAE best practices (e.g. a server is specified for A2 temperature range within X range of back pressure/external impedance).
References
[1] Alissa, H., Nemati, K., Sammakia, B., Ghose, K., Seymour, M., King, D., Tipton, R., (2015, November). Ranking and Optimization Of CAC And HAC Leakage Using Pressure Controlled Models. In ASME 2015 International Mechanical Engineering Congress and Exposition. American Society of Mechanical Engineers, Houston, TX.
[2] Shrivastava, S. K., & Ibrahim, M. (2013, July). Benefit of cold aisle containment during cooling failure. In ASME 2013 International Technical Conference and Exhibition on Packaging and Integration of Electronic and Photonic Microsystems (pp. V002T09A021-V002T09A021). American Society of Mechanical Engineers.
[3] Alissa, H., A.; Nemati, K.; Sammakia, B.G.; Schneebeli, K.; Schmidt, R.R.; Seymour, M.J., “Chip to Facility Ramifications of Containment Solution on IT Airflow and Uptime,” in Components, Packaging and Manufacturing Technology, IEEE Transactions on , vol.PP, no.99, pp.1-12, 2016.
[4] Alissa, H., A., Nemati, K., Sammakia, B. G., Seymour, M. J., Tipton, R., Wu, T., Schneebeli, K., (2016, May). On Reliability and Uptime of IT in Contained Solution. In Thermal and Thermomechanical Phenomena in Electronic Systems (ITherm), 2016 IEEE Intersociety Conference IEEE.
[5] Alissa, H., A., Nemati, K., Puvvadi, U., Sammakia, B. G., Mulay, V., Yan, M., R., Schneebeli, K., Seymour, M. J., Gregory, T., Effects of Airflow Imbalances on Open Compute High Density Storage Environment. Applied Thermal Engineering, 2016.
[6] Alissa, H. A.; Nemati, K.; Sammakia, B. G.; Seymour, M. J.; Tipton, R.; Mendo, D.; Demetriou, D. W.; Schneebeli, K., ” Chip to Chiller Experimental Cooling Failure Analysis of Data Centers Part I: Effect of Energy Efficiency Practices,” in Components, Packaging and Manufacturing Technology, IEEE Transactions, 2016.
[7] Wikipedia, (2016, February). Affinity laws. Available: https://en.wikipedia.org/wiki/Affinity_laws
NOMENCLATURE
AFC Active Flow Curve
CAC Cold Aisle Containment
CPU Central Processing Unit
CRAC Computer Room Air Conditioner -Direct Expansion-.
CRAH Computer Room Air Handler -Chiller-
FD Free Delivery (Design) airflow, [m3/s or CFM]
HAC Hot Aisle Containment
HDD Hard Disk Drive
IO Input/output
IT Information Technology
IT Servers, switches, Blades…
IPMI Inelegant Platform Management Interface
NG New Generation server
PC Critical Backpressure, [Pa or in. H2O]
SMART Data from a hard drive or solid state drive’s self-monitoring capability
TOR Top of Rack


