In the landing gear control module of an aircraft, a high-voltage IGBT is about to fail. In the solder bonding one chip’s ceramic base to its heat sink are three small air bubbles—voids, in the vocabulary of electronic failures.
The three voids are close together, and the largest is almost directly under a hot spot on the die. Collectively the voids have diminished the required flow of heat from the die, which is about to fail electrically as a result.
Avoiding failures such as this is the role of high-frequency ultrasound in the form of acoustic micro imaging tools. Acoustic imaging is performed on IGBTs and many other components individually or on trays by a tool.
The tool’s transducer scans a component at a horizontal speed up to 1-2 m/s, performing its pulse-echo function tens of thousands of times a second as it moves. The echo received from each x-y location will become a pixel in the acoustic image. Imaging ultrasound doesn’t travel through air, so after it leaves the transducer each pulse first moves through an accompanying column of a few mm of water coupling the transducer to the module.
IGBT modules, unlike most other components, are ordinarily not imaged from the top side because of the risk of contamination to the die. Voltages in IGBTs are typically very high. Even a trace of residue from impure water on the top side could cause a failure. To avoid this problem, a C-SAM tool was designed with an inverted transducer to interrogate IGBT modules from below, through the heat sink.
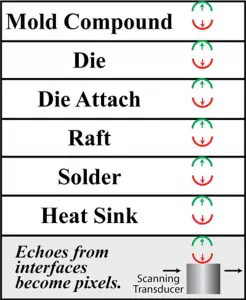
Ultrasound is reflected by material interfaces: when it meets the heat sink’s surface, part of the ultrasound is reflected back to the transducer, where its arrival time, amplitude, polarity, and frequency are recorded, and part travels across the interface and into the heat sink.

Figure 1 (not to scale) shows what happens next.
- The remaining pulse (green) crosses the interface and moves through the heat sink. At the interface between the heat sink and the solder, a portion of the acoustic pulse crosses the interface and the remainder is reflected back to the transducer.
- At the interface between the soldier and the raft, a portion is reflected while the other portion crosses the interface.
- Reflection and transmission occur at each of the remaining interfaces (raft to die attach, die attach to die, and die to mold compound).
Echoes on their way upward back to the transducer are again partly transmitted and partly reflected at each material interface. A pulse launched from the transducer can typically report data through several or more layers of material and produce the desired acoustic images.
All of the material interfaces in Figure 1 are between materials that are present by design. Acoustic imaging typically is used to find unintended interfaces. Most often these are interfaces between a solid (mold compound, the die, etc.) and air—meaning a void (more or less round), a delamination (more or less flat), or a crack (any shape).
The interface between a solid and air reflects very close to 100% of the pulse that strikes it. All of the other interfaces in a component are solid-to-solid, which reflect from a few percent to around 60%.
This means that solid-to-solid interfaces may be any color, but only solid-to-air interfaces are always the highest-amplitude color on the color map—typically bright white or red. These are the items that will impede heat transfer away from the die.
Most imaging involves gating, in which the transducer accepts for imaging at a given x-y location only those echoes that arrive within a specific time span after their launch. This avoids squeezing the whole thickness of the sample into one image, limits the acoustic image to the specific depth of interest in which air gaps are most likely to occur, and avoids vertical confusion.
If the user is, for example, chiefly concerned about an IGBT with voids in the solder between the heat sink and the raft, he may set a gate that encloses both surfaces of the solder. The transducer will accept for imaging only echoes originating within the defined time span and will ignore all other echoes because they will arrive outside the gated time.
The area of an air gap, or the total area of a group of air gaps, can be measured in the acoustic image to determine to what extent the gaps may impede heat flow. Air gaps of any configuration may exist in materials other than solder. A thin gap may exist between a metal and mold compound, for example, or as a crack within a mold compound. The returning echo reports amplitude, but also, by its arrival time, the depth from which the echo is returning. It can’t report the thickness of a delamination because ultrasound does not travel through the air to the other side of the gap.

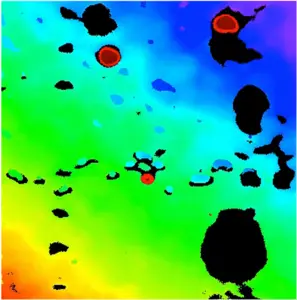
Figure 2 was produced by scanning the bottom side of an IGBT module with the inverted tool described earlier.
Echoes can report four properties of a substrate: the substrate’s distance from the component surface, the amplitude of the echo, the frequency of the echo, and the polarity of the interface. The background colors in this image—from lower left orange, green, blue—are reporting the depth of the ceramic raft. The varied colors indicate that the raft is warped. The highest points are orange.
Beyond the raft is the solder, and on this side of the solder lies the heat sink. This image was gated from near the top of the solder downward to the surface of the raft. Note that the gate does not include the interface between the heat sink and the solder. This was done in anticipation of air-filled voids lying flat against the heat sink. These voids block echoes returning from any lower depth from reaching the transducer. The voids are not imaged directly but appear as acoustic shadows—regions where no signal was received and are black for that reason. This is a high-power device, and the voids are numerous and may block significant heat from escaping.
There are also both dark blue and light blue voids deeper into the solder. Dark blue means that the void lies at the same depth as the dark blue regions of the ceramic raft. Light blue voids are at the depth of light blue on the raft. Whatever the color, they are still effective blockers of heat.
There are three voids that are orange, indicating that they lie at the depth of the highest parts of the raft. But portions of the same voids are also black. These voids seem to have a vertical structure that encompasses both depths and therefore displays both colors.
An X-ray can also be used to image air gaps. The X-ray beam moves through the material at high speed. Like ultrasound, it is attenuated to some degree just by traveling through a homogeneous material. When it strikes a material interface, it is not reflected. Instead, its rate of attenuation changes.
Note the difference, an X-ray beam striking a solid-to-air interface crosses the interface without attenuation. An ultrasonic pulse striking the same interface is almost entirely reflected back to the transducer and thus is not available to cross the interface.

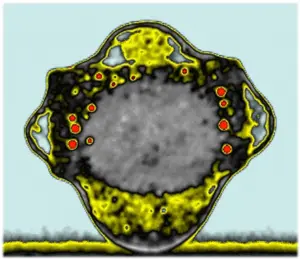
Figure 3 is the acoustic image of the die attach depth beneath the die in a TO-220 package. The image was made by scanning thousands of x-y locations on the backside of the substrate beneath the die.
The gray oval at the center shows the area covered by the drop of adhesive placed onto the substrate before the die was put in place. Partly cured, the adhesive formed a gray interface with the heat sink. When the die was added, it squeezed the fluid adhesive out in all directions, reaching all four corners of the die, with which it formed an interface that is black. Excess adhesive protrudes out from the four sides of the die. Pale blue marks the interface between the base plate and the mold compound.
Unfortunately, the moving adhesive trapped about a dozen air bubbles during spreading. They are the circular red features within the area of the die. Collectively they cover about just a few percent of the area of the die—not a large area, but some of them are so closely grouped that they might still be capable of causing local overheating of the die.
The acoustic images shown there used two acoustic imaging modes: time difference imaging (Figure 2) and C-mode imaging (Figure 3). There are a dozen additional acoustic imaging modes that can, for example, image a sample in either of two 3D modes, in any of three modes that interrogate the entire thickness of the sample, image the sample in 100 or more slices not necessarily of equal thickness, make multiple single-frequency images from the same scan, or make one or more non-destructive cross-section images through the sample.
Contact Information:
Nordson SONOSCAN
2149 E. Pratt Blvd.
Elk Grove Village IL USA 60007
Phone: 847-437-6400
Fax: 847-437-1550
E-mail: info@nordsonsonoscan.com
Website: www.nordsonsonoscan.com


