Introduction
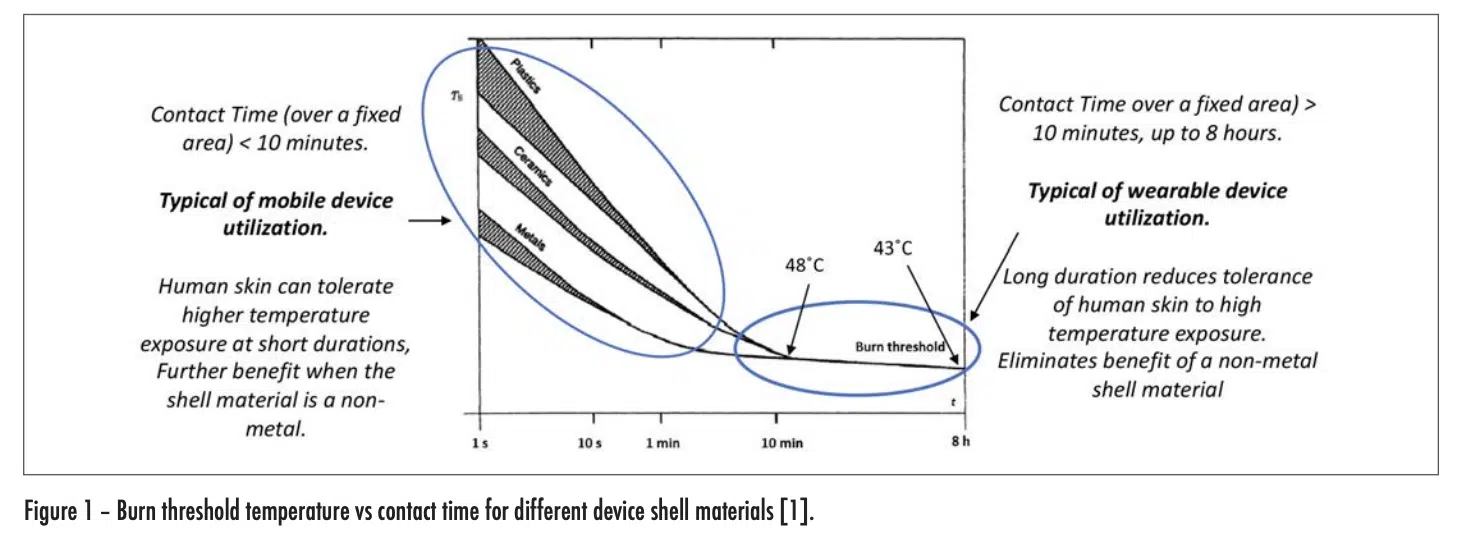
Mobile and wearable electronic devices are truly ubiquitous these days. Thermal engineers involved in the design of these devices are not only attentive to managing the temperature of the various components within these devices, but they are also careful to ensure that the temperature on the outer shell of these devices never exceeds certain limits as specified in the appropriate standards. These standards exist to protect the user from being burned by routine handling of any electronic device. The risk of burns increases as the device temperature and duration of contact between the device and the skin of the user increase. The graph in Figure 1 was extracted from a widely used international standard [1] and quantifies these relationships. Furthermore, it highlights the role of the thermal conductivity of the outer shell of the device in influencing burn risk. It shows that as the thermal conductivity of the device shell decreases, the burn risk decreases also.
It is the objective of this article to provide a deeper understanding of the underlying thermal mechanisms that are operative in the transfer of heat by an electronic device into human skin.
BIOTHERMAL MODEL OF HEAT TRANSFER IN HUMAN SKIN
Figure 2 depicts the flow of heat from an electronic device into the outer layer of skin (epidermis) of the user. The maximum temperature experienced by the user is in this layer. As the heat flows into the deeper layers of skin, it is then convectively removed from the heated region by the body-temperature blood flow from the arteries. The heated blood continues into the veins, whence it flows away from the heated region and is dispersed within the body.
The thermal model framework applied here follows the assumptions in what is widely referred to as the Pennes Model. Harry Pennes developed the first biothermal equation in 1940 [2]. It took the form of Fourier’s heat diffusion equation supplemented by the cooling of tissue by blood flow, which he called “perfusion.” He defined perfusion as a linear process in which heat transfer between the blood and the tissue is proportional to the temperature difference between incoming arterial blood and the outgoing venous blood. His model also accounted for the metabolic generation of heat.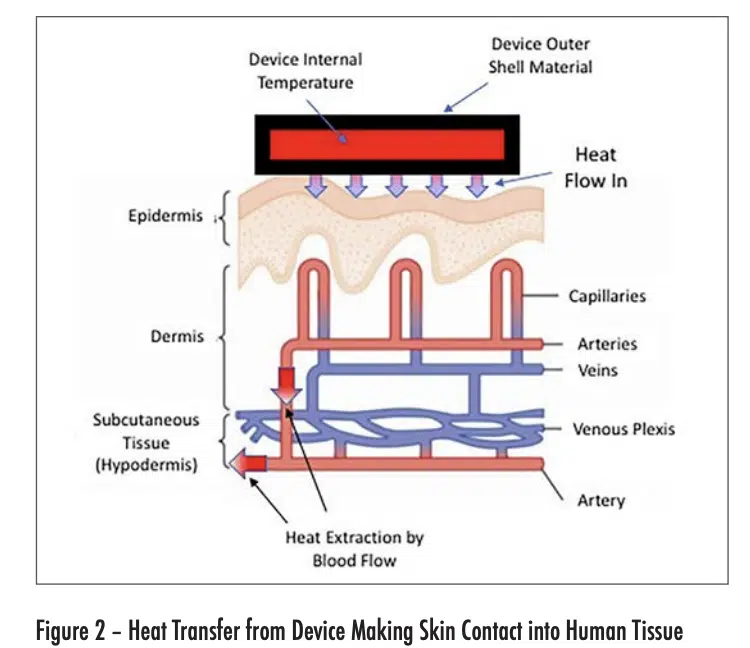
The heat flow situation depicted in Figure 2 has some simplifying characteristics. To a good approximation, the outer shell of the device is at a constant temperature in the contact region with the skin. Furthermore, the epidermis, dermis, and hypothermis are each thin compared with the width of the contact region and are reasonably constant in thickness. Also, the dermis and hypodermis are uniformly cooled by their own perfusion process. The net result is that the heat flow is one-dimensional, with a thermal gradient perpendicular to the surface of each layer in the device and skin structures.
As a consequence of these factors, the time-dependent conductive heat flow can be represented by a circuit consisting of linear resistance and capacitance elements. Furthermore, the perfusion heat flow process, being linear, can also be represented by a resistor. This circuit is depicted in Figure 3.
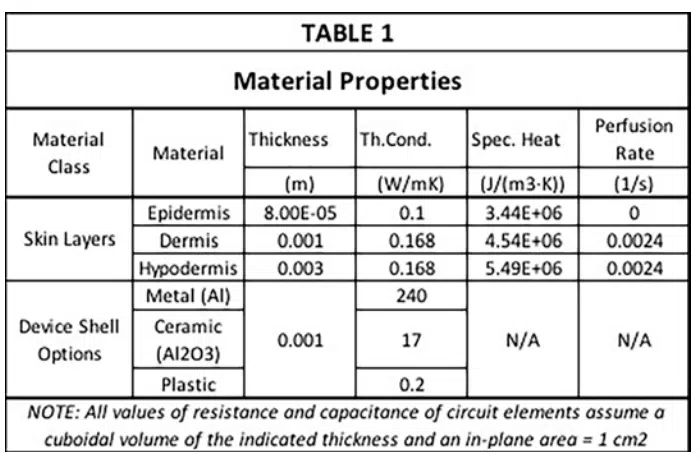
Table 1 contains all of the material properties specific to the tissues of interest needed to apply the Pennes model [3]. These data were obtained through heat transfer measurements on tissue on the underside (anterior side) of the forearm. The relevant properties are the thickness, specific heat, thermal conductivity and perfusion rate for all three skin layers. Note that the epidermis, not having any blood vessels, has a perfusion rate of 0. The dermis and hypodermis have similar values of thermal conductivity, specific heat, and perfusion rate, but differ in thickness by a factor of 3. The epidermis on the underside of the forearm is rather thin, say compared to that on the palms of the hand or the soles of the feet. Its thickness is about one-twelfth of that of the dermis. Furthermore, Table 1 provides thermal conductivity values of three different device shell materials having high, medium, and low values of thermal conductivity. This enables the simulated results to be compared with the heat transfer behavior implicit in the graph in Figure 1.
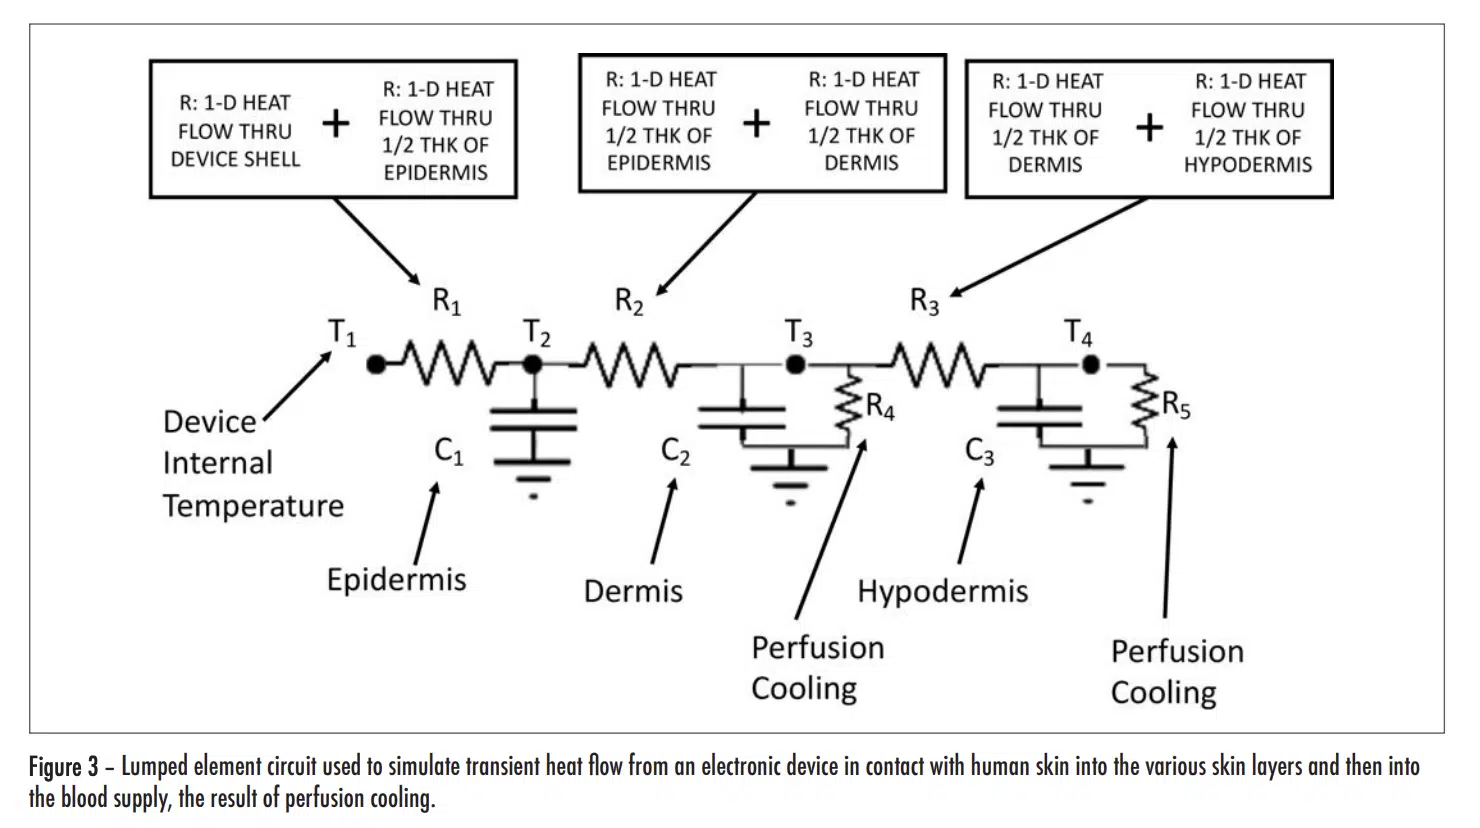
Table 2 provides the thermal resistance of all the R elements associated with conductive heat flow through each layer of skin and the shell of the electronic device (for each of 3 different shell materials having high, medium, and low thermal conductivities).
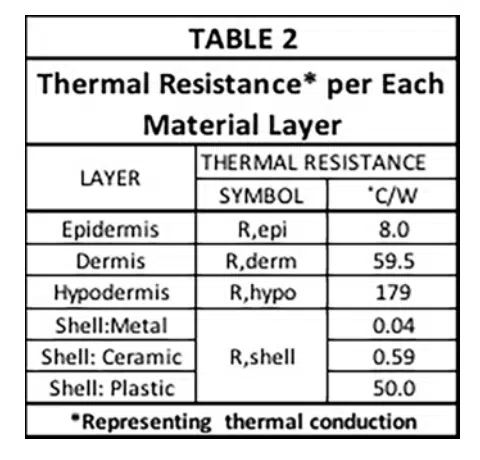
They are calculated using the usual formula for 1-D heat conduction:

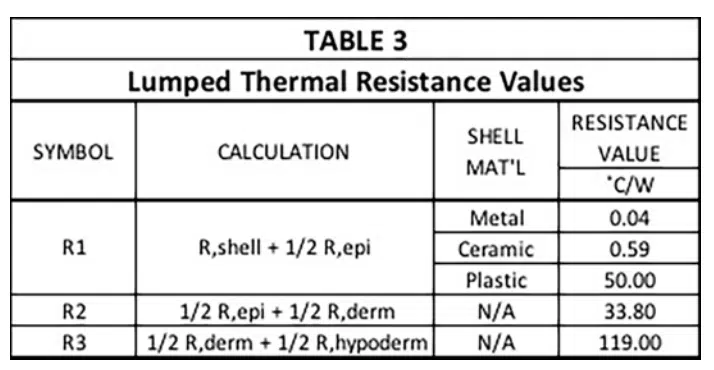
Note that these R values are not the final ones used to represent conduction heat transfer in the circuit. The reasoning is as follows: There are 4 nodes associated with temperature at various locations in the modeled structure. T1 is the temperature at a node located at the inner surface of the device shell and is user-specified. The other three temperatures, namely, T2 , T3 , and T4 , are calculated during the solution process and represent the average temperature in each layer of skin. In a 1-D heat flow situation, their associated nodes are located at the mid-plane of each cuboid representing a particular layer. The resistors, R1, R2, and R3, are, therefore referred to as “lumped” elements whose values represent combinations of resistances specific to particular material layers as indicated by the various caption blocks in the figure. Table 3 provides the calculated values for R1, R2, and R3.
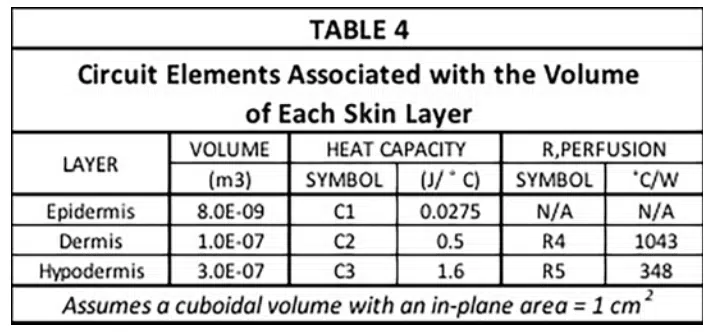
The capacitance values (C1, C2, and C3) and the two resistor values associated the perfusion cooling process (R4 and R5) are provided in Table 4. Their calculation involves the following two formulas.

Where w = perfusion rate (1/sec), ρ<sub>b</sub> = density of arterial blood, (1060 kg/m3), Cb = heat capacity of arterial blood (3770 J/kg-K), and V= volume of region to be cooled (m3) [3].
An iterative process is used to calculate the time-dependent values of temperature at all nodes in the thermal network. It has been used in the solution of transient behavior involving heat flow in semiconductor components and also moisture diffusion in circuit boards [4, 5].
Several temperatures were assigned to specific nodes before beginning the calculation. They are: 1) temperature of the inner surface of the device shell, set to 49°C, somewhat arbitrarily and 2) the temperature at the “ground” nodes. These were all set to 37°C, a typical value of arterial blood temperature for a healthy adult.
RESULTS
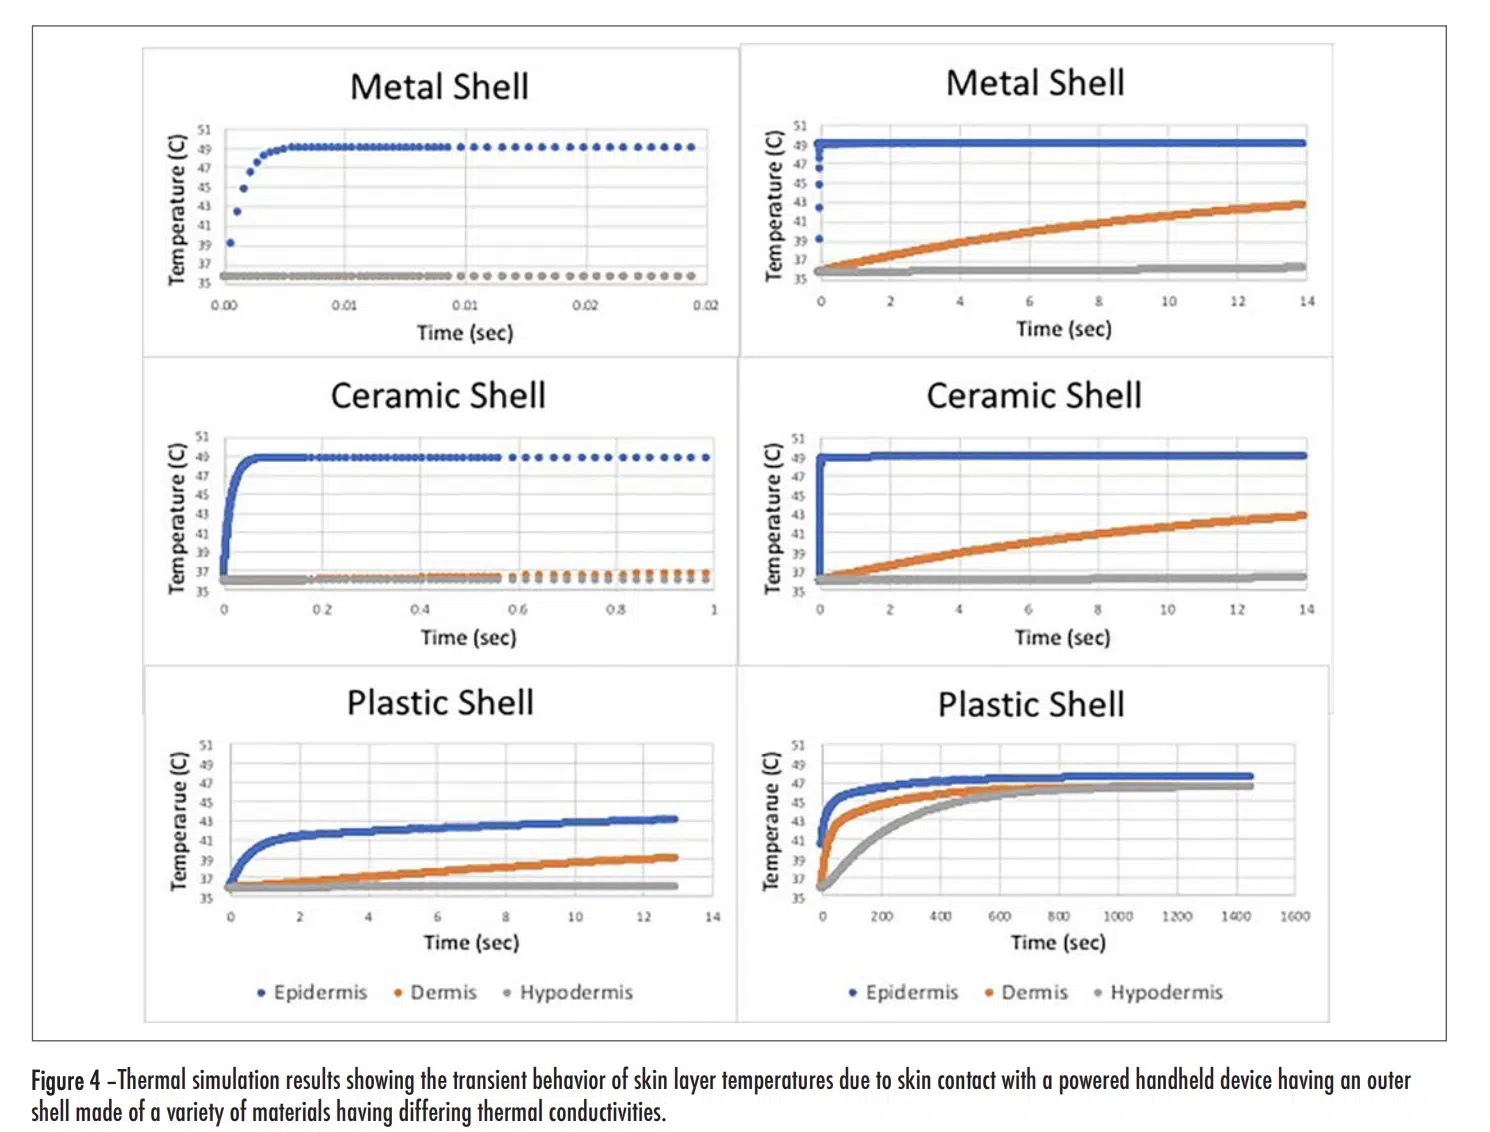
Figure 4 (see below) has two plots for each shell material option, a short duration one on the left and a longer duration one on the right. Overall, the graphs show temperatures for each of the three skin layers. In all cases, the epidermal layer had the highest temperature and the shortest time constant.
Short Duration Plots
As the thermal conductivity of the shell increased, the rise time decreased and the magnitude of the initial rise tended to also increase. With the metal and ceramic shells, the rise time was 0.017 and 0.04 seconds respectively, for them to reach a temperature of equal to 90% of the total rise. On the other hand, for the plastic shell, it took 1.1 seconds to it to reach a temperature equal to 90% of the initial rise. This is consistent with the behavior exhibited in Figure 1 for short duration exposures. Note that with all the shell materials studied, there was only a small change in the temperature of the dermis and hypodermis layers during the time of the initial transient.
Long Duration Plots
The plots representing the behavior with the metal and ceramic shell materials look very similar. At the end of the 14 second duration chosen for these graphs, the temperature for both the dermis and hypodermis layers increased by roughly the same amount, with the dermis temperature reaching one-half of the temperature rise of the epidermis layer. In this same period of time, roughly that chosen for the “short-duration” plot with the plastic shell, the epidermis and dermis temperatures increased by roughly one-half of the temperature rise experienced with the metal and ceramic shells. One takeaway from Figure 1 is that for exposure times in excess of 10 minutes, the thermal conductivity of the shell material ceased to be a significant factor in determining the burn risk. The long duration model results in Figure 4 for the plastic shell show the temperature of all the skin layers converging to nearly the same value and, by the time 1400 seconds have passed (23 minutes), the epidermal temperature is within a degree of that with the ceramic and metal shell materials. These results are certainly consistent with the longer term behavior of the graph in Figure 1.
CONCLUSION
A relatively simple thermal resistor-capacitor network has been developed to account for the increase in temperature of the epidermis, dermis, and hypodermis layers due to contact with the outer shell of an electronic device, for shells of low, medium, and high thermal conductivities. This model has predicted transient behavior involving relative changes in skin temperature that are consistent with those implicit in a leading standards document. Hence, it can provide an understanding of the heat transfer dynamics on the scale of individual skin layers.
The hope is that this article will give our readers greater insight into the workings of the Pennes model, which is widely used in the medical and biological fields, but not yet very much in the electronics industry. Certainly, as wearable electronic devices continue to proliferate, it will become important that thermal engineers become familiar with the Pennes model to enable them to add a biothermal component to their device thermal models.
REFERENCES
[1] IEC GUIDE 117 — Electrotechnical equipment – Temperatures of touchable hot surfaces Appendix A, 2010.
[2] H. H. Pennes, Analysis of tissue and arterial blood temperatures in resting human forearm, Journal of Applied Physiology, 1,(1948) pp. 93–122.
[3] Maria Strąkowska, et al., “Evaluation of Perfusion and Thermal Parameters of Skin Tissue Using Cold Provocation and Thermographic Measurements,” Metrol. Meas. Systems, Vol. 23 (2016), No. 3, pp. 373–381.
[4] B. Guenin, “Transient Modeling of a High-Power IC Package, Part 1,” Calculation Corner, Electronics Cooling, Dec, 2011. https://www.electronicscooling.com/2011/12/transient-modelling-of-a-high-power-ic-package-part-1/
[5] Application of Transient Thermal Methods to Moisture Diffusion Calculations, Part 1,” Calculation Corner, Electronics Cooling, Dec, 2012. https://www.electronics-cooling.com/2012/12/application-of-transient-thermal-methods-to-moisture-diffusion- calculations-part-i/
