Bruce Guenin, Assoc. Editor, Electronics Cooling
View Part 2 here.
Introduction
Many of the components currently used in electronics systems employ organic materials. Under certain circumstances, the diffusion of moisture into electronic components can lead to problems in the electrical performance and overall reliability of these components. Examples are the increase in the attenuation of high frequency signals in printed circuit boards and package substrates [1], reduction in optical fiber mechanical strength [2], and popcorn failure of organic packages during soldering operations[3].
On occasion, it is necessary to predict the rate of diffusion of moisture in organic materials in order to successfully manage these technical issues. The expertise for performing these calculations is often a rare commodity in engineering organizations. However, analogies between heat flow and moisture diffusion can be leveraged to allow the thermal engineer to perform accurate diffusion calculations by appropriately adapting more familiar thermal methods[4].
This article provides a procedure for quantifying moisture diffusion using a method, developed in a previous column, for the analysis of thermal transient problems involving the numerical solution of a multi-stage RC (resistor-capacitor) circuit [5,6].

Moisture Diffusion Examples
There are many situations in which the diffusion of moisture occurs in organic materials used in electronics hardware. Some are intentional such as: exposure to elevated temperature/humidity in conjunction with reliability or performance testing; and bake out procedures intended to promote the removal of moisture from components to avoid moisture-induced failures. Other exposures may occur in the field, while equipment is being stored in humid environments. Lastly, elevated temperatures resulting from equipment operation will reduce the moisture content of electronic components. In all of these cases it is important to be able to calculate the rate of moisture diffusion both into and out of the components of interest and to determine the moisture concentration at any time during the exposure.
Part 1 of this article deals with a simple one-dimensional moisture diffusion situation at a constant temperature, that can be applied to many situations of interest. Part 2 will deal with a 2-D moisture flow situation encountered in laminate semiconductor packages, both at a uniform temperature and under a thermal gradient resulting from the self-heating of the package.
Calculation Method
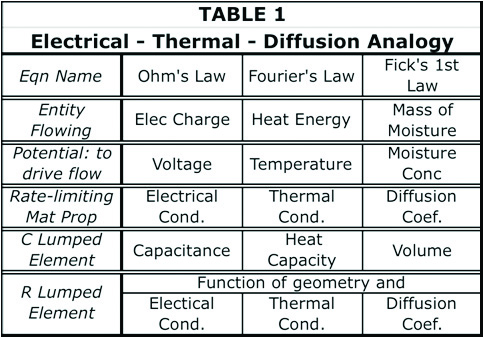
The basic equations governing heat flow and diffusion presented are indicated below. Equation 1 is commonly referred to as Fourier’s heat equation and Equation 2 as Fick’s first Law of diffusion.

In a recent installment of this column, a numerical solution of a multi-stage RC circuit was described and applied to the thermal analysis of a high-power chip in thermal contact with a heat sink [5,6]. This method can be applied directly to the diffusion problem, with appropriately calculated values of R and C.
The RC circuit assumed for the current calculations is presented in Figure 1. It is a 4-stage RC circuit, representing moisture flow from an external surface, represented by node 0, and flowing in a series fashion through 4 successive regions. The 4th node is an internal one and is not directly connected to the environment. These regions can be parts of a single component or material, or they can be different materials.
Figure 2 illustrates the operation of the numerical model, within a given time step, at a single stage in the circuit, in partitioning the incoming mass of moisture, MIN , into a portion flowing into capacitor Ci and a portion flowing through Ri into the adjacent node i+1. A detailed description of the numerical method, along with recipe for implementing it in a spreadsheet are found in Reference [5].

Model Assumptions
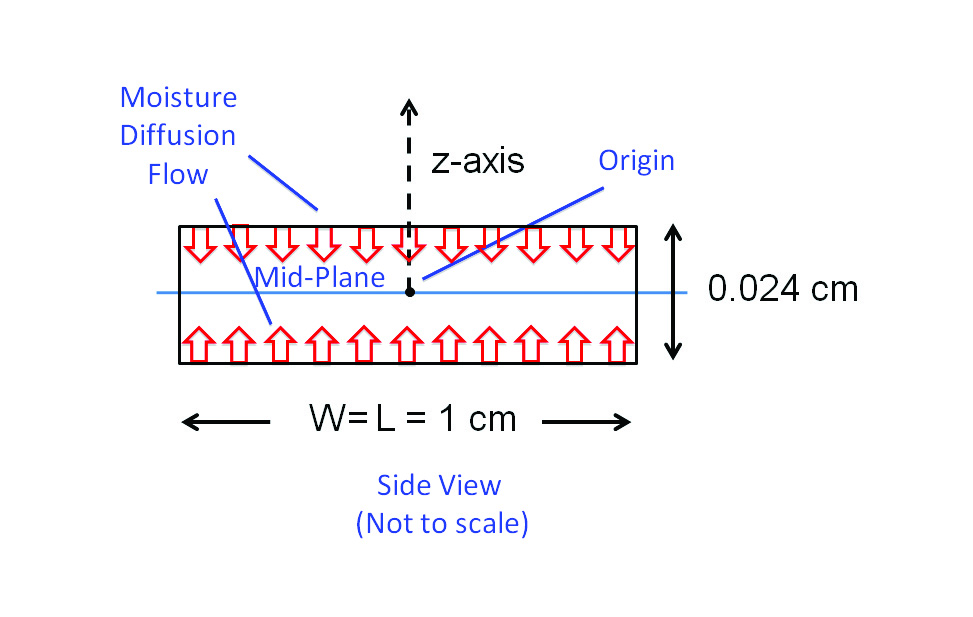
Figure 3 depicts a common situation encountered in diffusion problems: a slab of homogeneous material in which moisture diffuses from the top and bottom surfaces toward the mid-plane. Diffusion from the edges is neglected, due to their much smaller surface area. The material is assumed to be BT (bismaleimide triazine), a dielectric material commonly used in laminate semiconductor packages.
Two different environmental exposures are assumed: 1) 85˚C/85% RH “soak” and 2) 105˚C “bakeout.” In each case, the process is allowed to continue to completion; i.e.: the soak process achieves the saturation concentration of moisture throughout the sample and the bakeout process drives all moisture from the sample.
The sample thickness is somewhat arbitrary, but is representative of that for a single layer of a package laminate.


Diffusion Properties
Two material properties are needed to perform diffusion calculations: the diffusion coefficient, D, and the saturated concentration of moisture (ConcSAT). ConcSAT represents an upper limit for the moisture content of a particular organic material at given values of T and RH. These properties for the soak conditions were obtained from the literature [7]. To obtain a value for D at 105˚C for BT, it was necessary to calculate the activation energy, based on data from this reference taken at 50˚ and 85˚C, and extrapolate the data to 105˚C. The following equation relates the diffusion coefficient to the activation energy, U, where T is the absolute temperature and k equals Boltzmann’s constant.
Because of the functional form of this equation, log(D) is a linear function of log(1/T) , with the slope proportional to U.

Reference [7] also provides a value for % of moisture, by weight, equal to 0.5%, for a BT sample after saturation at 85˚C/85% RH. This is transformed into ConcSAT , the chosen parameter for this calculation, by multiplying it by the mass density of BT. The ConcSAT for the 105˚C condition was set at 0. The rationale for this choice was that the typical bakeout oven is open to the atmosphere. The partial pressure of water vapor at moderate levels of RH in the room containing the oven represents less than 1% RH at 105˚C. Table 2 summarizes the material properties used in the subsequent calculations.
Calculation of R and C Values
When the transient thermal method in References [5] and [6] was applied to a chip + package + heat sink configuration, the physical model was composed of distinct components made of differing materials. Consequently the partitioning of the physical model into discrete R and C regions was rather straightforward. The present example differs from this earlier one since it consists of a single material.
The method used in the current problem is as follows.
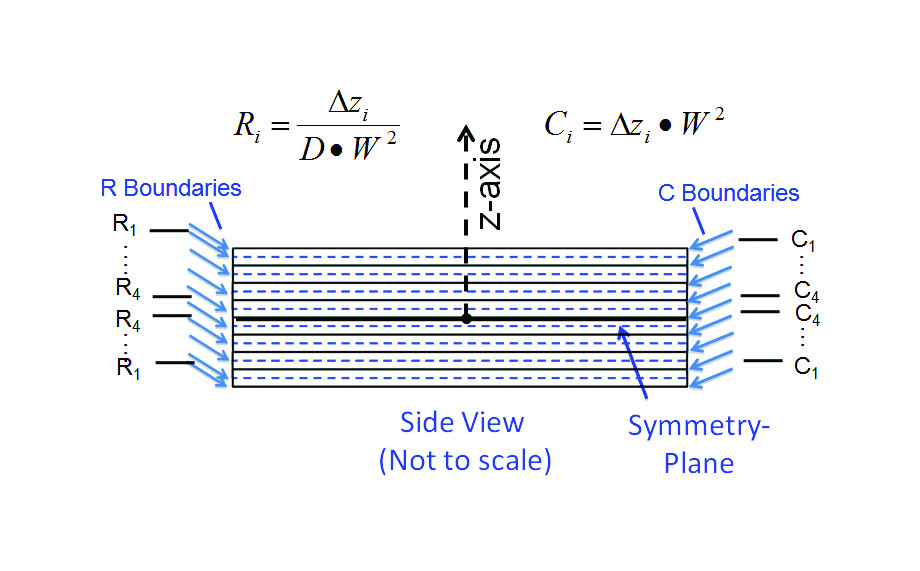
- Since there is a symmetry plane at z = 0, it is only necessary to solve for one half of the model. Due to symmetry, this solution applies to both halves.
- Divide each half-model into 4 separate cuboidal C regions of equal volume. The thickness of of each cuboid is equal to 1/8 times the total sample thickness = 1/8 x 0.024 = 0.003 cm.
- The R regions are assumed to connect the centroid plane of each C region to that of its neighbor. Hence, the ∆z value associated with each of these resistances would be 0.003 cm. The one exception is for the resistance between outermost C region (C1) and the exterior surface. In this case the ∆z value (for R1) would be 0.0015 cm.
The spatial boundaries of the different R and C regions are illustrated in Figure 3b. The Figure also indicates the formulas for calculating the R and C values for a 1-D diffusion situation. Table 3 provides the dimensions of each region and the calculated values of R and C based on the appropriate value of D and the specified geometry.
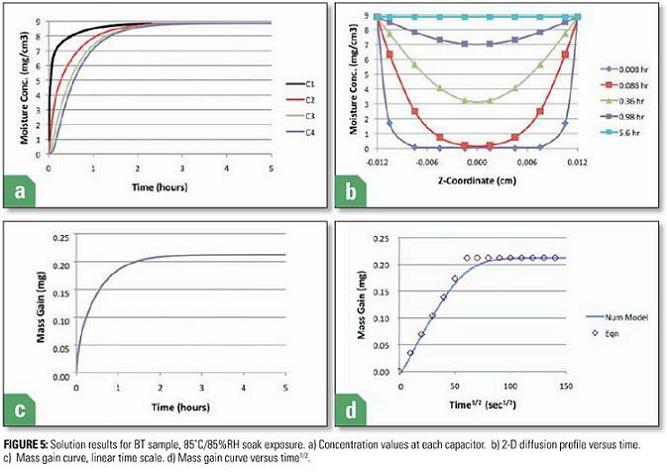
Figure 5 displays four graphs illustrating various aspects of the transient moisture behavior of the sample as it is transferred from a dry environment into the 85˚C/85%RH soak environment. Figure 5a plots the value of the moisture concentration in each of the four C regions. Region C1, representing the outermost region, responds most quickly. Conversely, region C4, associated with the innermost region, adjoining the symmetry plane, is the slowest to respond. Figure 5b plots each the value of moisture concentration calculated as various values of elapsed time versus the z location of the centroid of each C region. Results for all regions of the sample, both above and below the symmetry plane are plotted to assist visualization of the 2-D moisture concentration profile. It illustrates the time lag involved with the center region of the sample ultimately achieving moisture equilibrium with its environment.
Figure 5c plots the total mass of absorbed moisture versus time. It is calculated using the following equation. The prefactor of 2 results from the half-symmetry of the model.
The shape of the MH2O vs time curve is that expected in a soak situation. Its time constant (time to reach 63% of the saturated value) is 0.42 hours.
Finally, Figure 5c plots the total mass of absorbed moisture versus √time. This is a useful way of plotting diffusion data since the slope of the MH2O vs √time is a constant in the initial part of the diffusion transient. This behavior is quantified in Eqn 5.
where l is the thickness of the sample, which is assumed to be exposed to moisture from two opposing sides [6].
The symbols in Figure 5d for values < MSAT are generated using the above equation. This serves as a validation of the numerical procedure. Also, it serves as an analytical method for approximating the MH2O vs time curve it simple situations such as this, not requiring the precision of the numerical model.
The corresponding curves for the bake environment are shown in Figure 6. The sample is assumed to have been fully saturated with moisture from the 85˚C/85%RH at the moment it is placed into the bakeout oven at 125˚C. Qualitatively, the moisture versus time curves are the inverse of those in Figure 5. Quantitatively, however, the time constant for the bake process is approximately one-third of that in the soak process and is equal to 0.14 hour. This is due to the fact that at 125˚C, D is approximately three times its value at 85˚C. Figure 6b indicates, as before, that the moisture concentration at the center of the sample lags considerably behind the outer regions in equilibrating with the new, dry environment. The predicted curve in Figure 6d shows good agreement with the symbols, whose MH2Ovalues were calculated using Eqn 4 at the higher value of D, and where the slope was assigned a negative sign.
Comments Regarding the Generality of this Method.
The method presented here has been applied to a situation that could have been handled readily using purely analytical methods [2, 7, and 8] The rationale for doing so was to use a simple example for demonstrating the method clearly and to be able to use the accompanying analytical solution to validate the numerical model.
The RC circuit demonstrated herein can be adapted to a greater range of geometries, since elements representing different geometrical “primitives” can be combined [10]. Furthermore, it is possible to modify the numerical solution to accommodate parallel flux paths, to provide even more adaptability to a variety of applications [11]. Alternatively, it is possible to use SPICE-type electrical circuit simulation software to perform these calculations [12]. In contrast, closed-form analytical methods are generally limited to simple geometries, typically cuboids, cylinders, and spheres.
References
- J. Miller, Y. Li, K. Hinckley, G. Blando, B. Guenin, and I. Novak,” Temperature and Moisture Dependence of PCB and Package Traces and the Impact on Signal Performance,” Proceedings DesignCon Conference, Santa Clara, January 30 – February 2, 2012
- J. Mrotek, J. Matthewson, and C. Kurkjian, “Diffusion of Moisture Through Optical Fiber Coatings,” J. Lightwave Tech., Vol 19, No. 7, (2001), pp. 988-993.
- A. Xiao, G. Schlottig, H. Pape, B. Wunderle, K M. B. Jansen, L. J. Ernst, “Delamination and Combined Compound Cracking of EMC-Copper Interfaces,” Proceedings ECTC Conference (2010) pp. 114–120.
- J. Wilson, “Moisture Permeation in Electronics,” ElectronicsCooling, Vol. 13, No. 2 (2007).
- B. Guenin, “Transient Modeling of a High-Power IC Package, Part1,” ElectronicsCooling, Vol. 17, No. 4 (2011).
- B. Guenin, “Transient Modeling of a High-Power IC Package, Part2,” ElectronicsCooling, Vol. 18, No. 1 (2012).
- M. Pecht, H. Ardebili, A. Shukla, J. Hagge, and D. Jennings, “Moisture Ingress Into Organic Laminates,” IEEE Trans. Comp. Pack. Tech., Vol. 22, No. 1, (1999) pp. 104-110.
- A. Teverovsky, “Characteristic Times of Moisture Diffusion and Bake-out Conditions for Plastic Encapsulated Parts,” NASA white paper, October 15, 2002, available for download at https://nepp.nasa.gov.
- L. K. Massey “Permeability Properties of Plastics and Elastomers: A Guide to Packaging and Barrier Materials,2nd Ed.” Plastics Design Library.
- B. Guenin, “Heat Spreading Calculations Using Thermal Circuit Elements,” ElectronicsCooling, Vol. 16, No. 3, August, 2010.
- B. Guenin, “Transient Thermal Model for the MQUAD Microelectronic Package,” Proceedings SEMI-THERM X Conference, February, 1994, pp. 86-95.
- See, for example: http://en.wikipedia.org/wiki/SPICE.


