Baratunde A. Cola
Georgia Institute of Technology
INTRODUCTION
ASTM D5470 (updated to ASTM D5470-12 in 2012) [1] remains an industry standard for characterizing thermal interface materials (TIMs) despite some drawbacks. Ultimately, a TIM must be tested in its application to conclude its merits. Standardized testing is useful, however, for comparing TIMs in research and development. It is also useful for customers to validate data provided by vendors. Several modifications to ASTM D5470 have emerged to improve the accuracy of TIM measurements, and to increase measurement precision [2, 3]. Such improvements, however, usually come with increased equipment cost, and they do not eliminate the need for testing in-applications, so the total cost for testing can be high. Further, reproducible measurements based on ASTM D5470 remain challenging to achieve, and recent studies to improve the accuracy of this standard have not focused on quantifying measurement reproducibility with large sample sets. The need for improved measurement reproducibility (e.g., a type of sample is measured, removed from the apparatus, and measured over many cycles with very similar results) is known to the community, and continues to limit cost-effective TIM development.
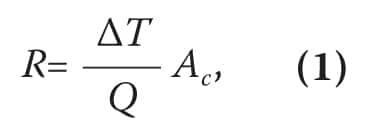
The approach to calculate the specific thermal resistance of a TIM based on ASTM D5470 measurements is:
Because possible misalignments are usually neglected in uncertainty analysis, we could not find published experimental data that quantifies the role misalignments have in measurement uncertainty (this is done numerically in [4]). But our colleagues in industry and academia tell us that their data scatter for a large set of the same type of sample is often much larger than what their measurement uncertainty analysis predicts, even when considering reasonable variations in the properties of the samples. This is especially true for delicate nanomaterials (e.g., carbon nanotube TIMs [5]) and other samples that can be damaged while trying to optimize alignment of the reference bars.
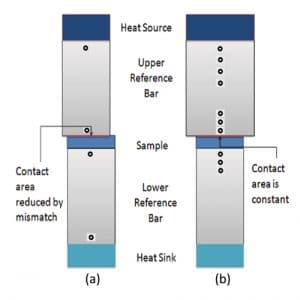
This article highlights the “stepped-bar” modification of ASTM D5470 shown in Figure 1b. The modification can improve measurement reproducibility, while also reducing system cost. A comprehensive uncertainty analysis derived from the Kline and McClintock method for the stepped-bar ASTM D5470 is presented in [4]. This analysis shows that, in addition to high reproducibility, the stepped-bar approach can produce lower measurement uncertainty than the standard ASTM D5470 when very precise thermocouples (± 0.001 K) are used, and the mismatch in reference bar area alignment is greater than 1% in the standard approach. The reader is referred to [4] for a comprehensive description of the stepped-bar ASTM D5470 technique.
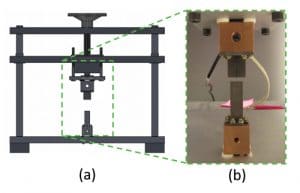
The stepped-bar design oversizes the upper reference bar (URB) as shown in Figures 1b and 2. This modification allows machining errors and bar misalignments without a reduction in the contact area between the URB and the TIM. The operator only has to align the TIM to the lower reference bar (LRB) – a two surface alignment – rather than aligning the sample to both reference bars – a four surface alignment. This obviates the need for expensive bar alignment and loading mechanisms, which can often be the largest component costs in the system.
A mechanical transducer, comprised of a threaded rod and steel hand wheel, applies pressure to the TIM under test in the stepped-bar approach. The use of a mechanical transducer can greatly lower the cost (~50%) of the entire apparatus in comparison to a stepper motor or pneumatic-based loading system. Because instabilities of the threaded rod introduce imprecision in aligning the URB with the LRB, the oversized URB ensures that these misalignments do not reduce the contact area of the sample and introduce errors into the thermal resistance measurements. In the design shown in Figure 2, the URB has a square cross-sectional area measuring 1.4 cm to a side. And the LRB has a square cross-sectional area measuring 1.0 cm to a side. The URB and LRB are 1.5 cm and 3.0 cm long in the axial direction, respectively. Additional details of this design are reported elsewhere [4].
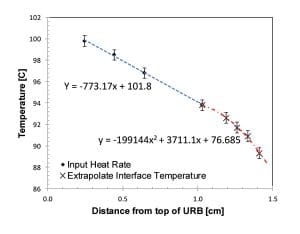
The oversized geometry of the URB, and dividing the URB into 2 regions for curve fitting are the major differences between the stepped-bar ASTM D5470 and the standard ASTM D5470. The temperature profile remains linear in the LRB for both approaches.
STEPPED-BAR MEASUREMENTS OF TIMS
The stepped-bar ASTM D5470 (aluminium 2024 reference bars with Ra ~ 0.5 μm, flatness = 0.1-0.3 μm) was used to characterize Arctic Silver 5 and Ceramique thermal paste [4]. A small amount of spacer-grade, soda lime glass microspheres (22-25 μm) from Cospheric was added to these pastes to maintain a constant bond-line thickness. Thermal resistances of 32 ± 4.5 mm2K/W and 41 ± 4.5 mm2K/W were measured at an applied pressure of 300 kPa for Arctic Silver 5 and Ceramique, respectively. The United States National Renewable Energy Laboratory (NREL) reported a resistance of 30.9 mm2K/W for Arctic Silver 5 with a bond line thickness of 23.5 um [6], which is similar to the value measured with the stepped-bar. The NREL study used an experimental apparatus based on the standard ASTM D5470 with reference bars polished to 0.5 μm. This result indicates that the stepped-bar approach can be implemented with no significant loss in measurement accuracy.
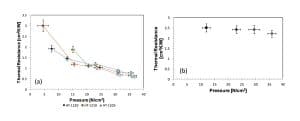
The thermal resistance of aluminium foil 10 microns thick and three graphite samples from GrafTech (HT-1220, HT-1210, and HT-1205) were also measured with the stepped bar. The thermal resistance versus applied pressure for these samples is shown in Figure 4. The measurements on thermal paste, graphite, and aluminium foil span an order of magnitude in thermal resistance, and show a range of practical resistance that can be characterized with the stepped-bar approach.
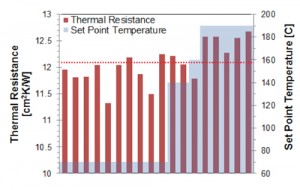
Stockwell Elastomeric TC100 thermal gap (1.575 mm thick, manufacturer’s reported resistance of 12.12 cm2K/W [7]) pad was also tested. The gap pad was tested at the manufacturer’s specified pressure of 690 kPa. For each measurement, the sample was removed from the apparatus and reinserted to account for operator error in aligning the sample to the LRB. Figure 5 shows the frequency histogram for all measurements of the TC100 gap pad using the stepped-bar ASTM D5470 with stainless-steel reference bars. The average specific thermal resistance measurement was approximately 12.09 cm2K/W. The standard deviation of the eighteen measurements was 0.38 cm2K/W. A confidence interval based on the student’s T distribution suggests that 95% of all measurements of the TC100 gap pad fall within 6.4% of the mean value. These results imply excellent repeatability of the stepped-bar ASTM D5470 under these testing conditions. Likewise, the manufacturer-specified thermal resistance value of 12.12 cm2K/W falls within this 95% confidence interval, suggesting excellent measurement accuracy.
This article highlights the importance of accounting for reference bar alignment for reproducible TIM measurements. A stepped-bar modification to ASTM D5470 [4] is discussed and shown to produce very reproducible and accurate measurements of a commercial thermal gap pad. The thermal resistance of Arctic Silver 5 was also measured to be in good agreement with other reports, which used the conventional ASTM D5470.
In order for the stepped-bar apparatus to achieve the same uncertainty as that of a conventional ASTM D5470 apparatus, more temperature probes are required. Each additional temperature probe increases the cost of the apparatus. However, the stepped-bar apparatus offsets this marginal expense because it utilizes an inexpensive mechanical transducer instead of more costly pneumatic-based alignment mechanisms that are required to precisely align reference bars of equal cross-section area. The stepped-bar ASTM D5470 is simple enough for a skilled technician to set up in one day when all parts are available, and the total cost of the parts is about $9,700 (for a parts list see [4]). This cost is about 3-5 times less than the cost of several commercial systems based on ASTM D5470.
A round robin of tests in different labs, and with several different TIMs, is ultimately required to conclude the superior reproducibility of stepped-bar ASTM D5470 approach. But there is a clear cost advantage, which could save resources for increased testing of TIMs in their application.
ACKNOWLEDGEMENTS
Assistance with data collection and analysis from Dakotah R. Thompson is appreciated.
REFERENCES
[1] ASTM, “Standard Test Method for Thermal Transmission Properties of Thermally Conductive Electrical Insulating Materials,” in D5470-12, ed. West Conshohocken, Pennsylvania: ASTM International, 2012.
[2] R. Kempers, P. Kolodner, A. Lyons, and A. J. Robinson, “A high-precision apparatus for the characterization of thermal interface materials,” Review of Scientific Instruments, vol. 80, January 7 2009.
[3] D. Kearns, “Improving accuracy and flexibility of ASTM D 5470 for high performance thermal interface materials,” presented at the IEEE Semiconductor Thermal Measurement and Management Symposium, 2003.
[4] D. R. Thompson, S. R. Rao, and B. A. Cola, “A Stepped-Bar Apparatus for Thermal Resistance Measurements,” ASME Journal of Electronic Packaging, vol. 135, p. 041002, 2013.
[5] B. A. Cola, “Carbon Nanotubes as High Performance Thermal Interface Materials,” Electronics Cooling Magazine, vol. 16, pp. 10-15, 2010.
[6] S. Narumanchi, M. Mihalic, and K. Kelly, “Thermal Interface Materials for Power Electronics,” presented at the Itherm 2008, Orlando, Florida, 2008.
[7] S. Elastomerics. (2012, November 20). Thermally Conductive Silicon Rubber Heat Transfer Pads and Gaskets from Gap Filling Compounds. Available: http://www.stockwell.com/data_sheets/thermal/se200_thermal_mgmt_products.pdf
ABOUT THE AUTHOR
Baratunde “Bara” Cola is an assistant professor in the George W. Woodruff School of Mechanical Engineering and the School of Materials Science and Engineering at the Georgia Institute of Technology. He received his B.E (2002) and M.S. (2004) from Vanderbilt University, while a member of the Vanderbilt Football Team, and his Ph.D. (2008) from Purdue University, all in mechanical engineering. Bara has received prestigious early career research awards from DARPA (2009), NSF (2011), and the Army (2013), and received the Presidential Early Career Award for Scientist and Engineers (PECASE) in 2012 from President Obama for his work in nanotechnology, energy, and outreach to high school art and science teachers and students. Recently, Bara was awarded the 2013 AAAS Early Career Award for Public Engagement with Science. In addition to building knowledge and training students, his many published journal articles, book chapters, and conference proceedings have helped to produce 2 issued patents and several pending patents, which lead to Bara founding Carbice Nanotechnologies, Inc. in 2012 to commercialize carbon nanotube thermal interface materials. Bara’s work is currently focused on characterization and design of thermal transport and energy conversion in nanostructures and devices. He is also interested in the scalable fabrication of organic and organic-inorganic hybrid nanostructures for novel use in technologies such as thermal interface materials, thermoelectrics and thermo-electrochemical cells, infrared and optical rectenna, and materials that can be tuned to regulate the flow of heat.

