Wendy Luiten
Philips Research, Eindhoven, the Netherlands
INTRODUCTION
Active LEDs in a consumer TV product are boosted and dimmed with the video picture content. Boosting and dimming of the LEDs is a powerful means to improve visual experience, either through application of active LEDs in an ambient light feature, or through dimming and boosting of the display LEDs in a direct lit video display. Active driving of LEDs also is a significant consideration in the thermal management of a video display product [1, 2]. However, active driving of LEDs increases the number of temperature cycles by several orders of magnitude, and thermal cycling is well known to lead to so-called low cycle fatigue solder joint failure. How then will active driving of LEDs affect the lifetime of LED solder joints in a TV product?
SOLDER FATIGUE AT LONG TIME SCALE
The root cause of low cycle fatigue solder joint failure is that thermal mismatch between a component and PCB is taken up in deformation of the solder joint. Assume that a SMD LED is subjected to an instantaneous temperature rise at t=0 s. This results in a thermal shear strain εT in the solder joint, proportional to the temperature change, εT ~ ΔT. At t=0s the entire thermal strain is taken elastically. By Hooke’s law, the shear stress σ is proportional to the elastic strain εe with proportionality constant G, the solder’s shear modulus G= E/2(1+ν). Thus, at the instantaneous temperature rise σ0 = G ∙ εe = G ∙ εT. At longer times the solder starts to creep, that is to flow very slowly, and part of the thermal strain is taken in creep strain εc. This lowers the elastic strain and the stress relaxes.
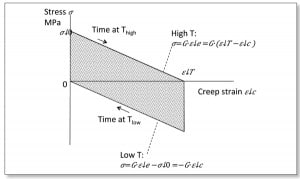
When the creep strain equals the thermal strain,εc=εT, the elastic strain is zero and the joint is stress free. If the temperature is then lowered by -ΔT, the change of temperature with respect to the stress free situation will again cause a thermal mismatch, which will again cause stress in the solder joint,-σ0, which will again relax away to the stress free situation through solder creep. In this manner, temperature cycles result in cyclic loading, creep and stress relaxation in the solder joint. The diagram of stress versus creep strain is shown in Figure 1.
In each cycle, an amount of damage is incurred that is proportional to the area inside the stress- creep strain loop. Solder joint failure occurs once the total accumulated creep damage exceeds a certain value, C, which is usually determined through an accelerated test. Figure 1 shows that the area inside the loop for a full creep cycle up to the stress free situation equals σ0 ∙ εT. It follows that the area of the loop is proportional to ΔT2:
A similar relationship is also found in the low-cycle fatigue law of Coffin-Manson [4], in the work of Engelmaier [5, 6] and of Norris-Landzberg [10] in the form of fatigue exponent, which roughly corresponds to a value 2. The quadratic dependency is also the basis for the common design rule relating the number of cycles to failure in operation Nf to the number of cycles to failure Ntest in an accelerated test with temperature sweep ∆Ttest:
The fatigue cycle shown in Figure 1 will only appear if the heating and cooling is instantaneous, and if dwell times are sufficiently long to allow for relaxation up to the stress free situation. It is well-known that the durations of ramp time and dwell time have a significant impact in accelerated temperature cycle tests [7]. Both the Engelmaijer and the Norris-Landzberg model incorporate the effect of field vs test timing in a time factor in their models. However, it is not obvious that these models are appropriate for short video time cycles. Typical temperature cycle tests have at most 1 order of magnitude difference from test to field condition. Since temperature effects dominate the acceleration factors it then becomes difficult to separate out time effects with accuracy. Furthermore lifetime, test timing parameters and test temperatures are interrelated in a complex manner [10], therefore separation of time and temperature effects does not lend itself to extrapolating with confidence. As an example the Engelmaijer relations were critically reviewed in [8] and shown not to be reliable for several cases. Hence using existing simple models incorporating the cycle time effects is not straightforward for short video cycles and more accurate numerical investigation using FEMare often not possible in view of limited project resources.
SOLDER FATIGUE AT SHORT TIME SCALE
The purpose of the current work is to find out the influence of short cycle times on solder failure in a less resource intensive manner, allowing for a better lifetime estimate in a safe engineering envelope. Direct integration of the creep strain rate is used to determine how much creep will actually occur in the cycle time.
The flow rate or creep strain rate of solder is extremely dependant on stress and temperature. According to Syed’s formulation of the Schubert model for Lead free solder [9] the creep strain rate is the product of a stress dependent part g(σ) and a temperature dependent part f(T).
Table 1 shows the values for the material parameters A through D, as well as the elastic modulus E and Poisson ratio ν.
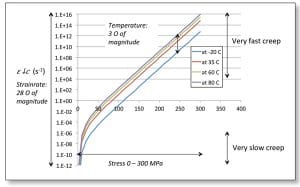
Figure 2 shows the calculated creep strain rates for a -20 °C to 85 °C temperature range and 0 – 300 Pa stress range. It shows that the shear strain rate varies 28 orders of magnitude over the stress range. At high stress levels the extremely high creep strain rate will immediately relax the stress to a lower level, so this part of the stress relaxation does not cost significant time. At low stresses, the very low creep rate will result in negligible creep in the time range of 1 – 104 s. Figure 2 also shows that the creep strain rate varies 3 orders of magnitude in the temperature range -20 to +80 °C. In contrast, from table 1, the variation in the elastic modulus over the same temperature range is only 14%. Therefore, in all subsequent calculations the shear modulus will be taken at the mean temperature of the high and the low temperature.
Total creep in the cycle time is closely coupled to the amount of stress relaxation. The stress relaxation curves at a certain temperature are obtained in the following way:
The shear stress is proportional to the shear strain. Taking the time derivative of Equation 1 and substituting Equation 6:
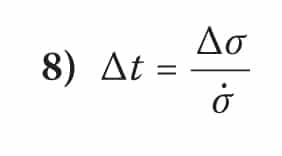
For sufficiently small increments ∆σ this can be used to find the time that it takes to realize the stress increment.
Summing the time increments associated with the stress increments results in an approximation of the stress relaxation over time. The whole scheme is easily implemented in a spreadsheet, as shown in Figure 3. The corresponding stress relaxation curves at -20 °C and +85 °C are shown in Figure 4.
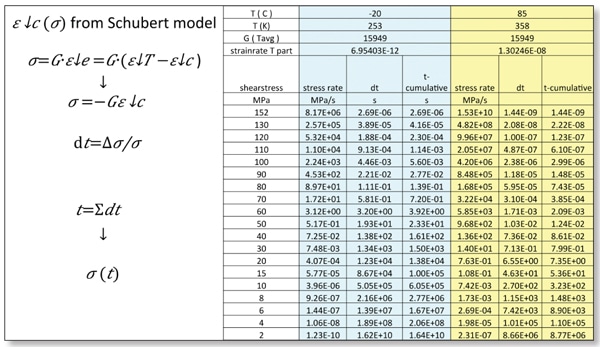
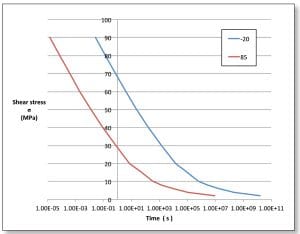
Similar curves can be made for different initial stress levels and different temperatures, and these are used to determine how much stress relaxation will take place in a certain creep time. Subsequently the stress- creep strain cycle can be constructed.
VIDEO LED APPLICATION
We consider an idealized temperature cycle with instantaneous temperature change, and an equal time at the high and at the low temperature. Four cases are of interest: a) the accelerated test, b) the on/off cycle, c) a long 100 s video cycle, and d) a short 5 s video cycle. Figure 5 shows the calculated stress/creep strain cycles and table 2 the load case details and resulting creep strain.
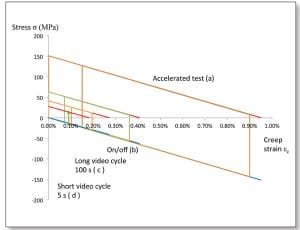
In all cases, even in the accelerated test, creep times turn out to be too short for full creep to occur. Figure 5 and table 2 show that using a large temperature step in the accelerated test case works out like intended: the area of the test cycle is much larger compared to the use cycles, thus failure will be accelerated and the failure energy value can be obtained in shorter time. Creep in the on/off cycle case is slightly less complete compared to the accelerated case, therefore using the accelerated test to predict the number of cycles to failure as per the normal design rule in equation 3 works out well with a sensible engineering margin of (79/71-1)=11%. This is not the case for the video cycles. Not taking the short time effect into account leads to roughly a factor 2 underestimation in lifetime for the long video cycle. In case of the short video cycle the temperature excursions are all taken elastically, no creep damage is incurred and use of equation 3 is not appropriate at all. This shows that for short cycle times the time effect must be taken into account for correct lifetime prediction of the solder joints.
SUMMARY AND CONCLUSION
The effect of short creep time on low cycle fatigue failure of SMD LEDs was investigated. It was shown that for an idealized case with instantaneous temperature change, full creep i.e. stress relaxation to the stress free level, and with temperature independent elastic moduli, the creep damage per cycle is proportional to ∆T2. Direct integration was used to construct stress relaxation curves incorporating the highly non-linear behavior of the lead free solder as per the Syed/Schubert model and these were used to construct a simplified stress-strain fatigue cycle, incorporating the effect of creep time. Application to active LEDs in a TV product demonstrated the validity of accelerated testing and the ∆T2 design rule to product on/off cycles. In contrast, this was not the case for the typical video cycle times. The short cycle times only allow for partial creep, doing less damage per cycle, and so the use of the uncorrected design rule leads to under prediction of solder joint lifetime. At very short cycle times the cyclic thermal mismatch is taken fully in elastic excursions with no creep at all, and low cycle fatigue is not the appropriate failure mode. Although the the complexity of the solder joint fatigue cycle was very much simplified in the work, the approach was shown to be of merit in clarifying main effects in low cycle solder fatigue, and in enabling correct first order engineering estimations using only a commercial spreadsheet.
ACKNOWLEDGEMENTS
The support of Philips Research and of TP Vision Innovation sites Eindhoven and Bruges is gratefully acknowledged.
REFERENCES
[1] Luiten, G. A, Chapter 14, “Thermal Challenges in LED-Driven Display Technologies: State-of-the-Art” in C. J. M. Lasance, A. Poppe (eds.), Thermal Management for LED Applications, 1 Solid State Lighting Technology and Application Series 2, DOI 10.1007/978-1-4614-5091-7_14, july 2013.
[2] Luiten, G. A. and ter Weeme, B. J. W. (2011), “Thermal management of LED-LCD TV display”, Journal of the Society for Information Display, 19: 931–942. doi: 10.1889/JSID19.12.931
[3] van Driel WD, Yuan CA, Koh S, Zhang GQ (2011) “LED system reliability”, 12th. Int. Conf. on Thermal, mechanical and multi-physics simulation and experiments in microelectronics and microsystems EuroSimE 2011, pp 1/5–5/5
[4] http://en.wikipedia.org/wiki/Fatigue_(material), last retrieved 15 June 2013
[5] Engelmaier, W., “Achieving Solder Joint Reliability in A Lead-Free World, Part 1”, Global SMT & Packaging, Vol. 3, No.6, June 2007, pp. 40-42
[6] Engelmaier, W., “Achieving Solder Joint Reliability in A Lead-Free World, Part 2”, Global SMT & Packaging, Vol. 7, No.8, August 2007, pp. 44-46
[7] Y. S. Chan and S. W. Ricky Lee, “Detailed Investigation on the Creep Damage Accumulation of Lead-free Solder Joints under Accelerated Temperature Cycling “,11th. Int. Conf. on Thermal, Mechanical and Multiphysics Simulation and Experiments in Micro-Electronics and Micro-Systems, EuroSimE 2010
[8] Preeti Chauhan, Michael Osterman, S. W. Ricky Lee, and Michael Pecht,” Critical Review of the Engelmaier Model for Solder Joint Creep Fatigue Reliability” IEEE Transactions On Components And Packaging Technologies, Vol. 32, No. 3, September 2009
[9] Ahmer Syed, “Accumulated Creep Strain and Energy Density Based Thermal Fatigue Life Prediction Models for SnAgCu Solder Joints”, originally published 54rd ECTC 2004,(pp 737 – 746), corrected version retrieved 06052010 http://ansys.net/ansys/papers/asyed_ectc2004_corrected.pdf
[10] Michael Osterman, “Effect of Temperature Cycling Parameters (Dwell and Mean Temperature) on the durability of lead-free solders” IMAPS Chesapeake Area Winter symposium January 27th, 2010


