Heat dissipation of active devices has become one of the limiting factors in further miniaturization. While component manufacturers succeed in decreasing the overall thermal resistance of their packages, the thermal interface resistance to the board becomes the next limiting factor. Therefore, understanding interface and contact resistances becomes increasingly important for engineering purposes. Furthermore, thermal modeling of packages in board and system level software tools requires accurate thermophysical property data, among which are thermal interface and contact resistances.
In this article, the term interface resistance is used to define the thermal resistance of the layer between one surface of an electronic device and its mounting surface. The layer may consist of only contact resistances, heat sink compounds, metallic coatings, insulation sheets, or combinations of these. Various materials, including thermal greases, thermally conductive compounds, elastomers, adhesive tapes and phase change materials, all designed to enhance thermal contact are commercially available. While the number of available materials is growing rapidly, the need to be able to measure them increases. This is also clear from the growing number of papers reporting test results for various materials. (For an overview see Bosch & Lasance [2000].)
The physical phenomena that rule the heat transfer between two contacting materials have been the subject of experimental and theoretical research over the past 50 years. Some useful models, which provide physical insight into the underlying mechanisms for heat transfer through interfaces, are available (Yovanovich et al. [1997]). Unfortunately, due to the large number of parameters involved (e.g., contact area, surface roughness and flatness, contact pressure and thermal diffusivity), little progress has been made in obtaining the required accuracy starting from first principles. This is another reason why accurate measurements are needed.
Almost all methods used for measuring interface resistance are based on steady state experiments. Such an experiment closely resembles the standardized methods for the measurement of the thermal conductivity of slabs, which are based on a direct application of Fourier’s law. Despite the simplicity of this law, it is generally very difficult to guarantee its applicability.
In order to overcome these problems, a transient method for measuring thermal interface resistance was proposed by Lasance & Lacaze (1996) and extended by Bosch & Lasance (2000).
A transient method has, as further advantages over the steady state method, its (much) smaller timescale (minutes instead of hours) and flexibility. This observation is increasingly recognized, as testified by commercially available equipment based on transient methods. However, it should be stressed that high accuracy cannot be expected, despite the claims of the vendors. The reasons for this are beyond the scope of this article.
This paper describes the authors’ experimental setup, developed for the transient measurement of thermal interface resistances to overcome the difficulties associated with steady state methods.
Basic Features of the Experimental Setup
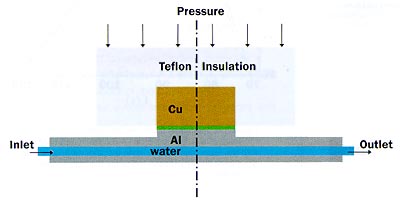
Figure 1. Sketch of the test facility.
Figure 1 presents a schematic view of the experimental facility. The facility consists of an upper cylinder of copper, insulated with Teflon, and an aluminum support provided with a heating/cooling channel. The copper cylinder has a height of 2 cm and a diameter of 4 cm. The sample to be measured is positioned between the two metal parts.
The heating/cooling channel is connected to two water baths: one at ambient temperature; the other at an elevated temperature (80°C for the present experiments), selectable through a manual valve. Initially, water from the first bath is forced through the aluminum support. After reaching thermal equilibrium, the hot water is switched on for about 30 s, followed by a switch back to ambient temperature. Temperatures of the two metal parts are registered by means of two thin thermocouples.
A pressure sensor is incorporated to measure the force, which can be varied by means of weights (not shown). The construction was specially designed to guarantee a good alignment so that the forces on the interface are evenly distributed over its surface.
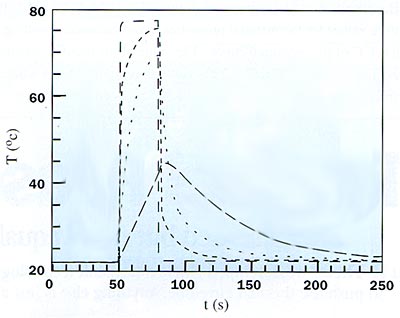
Figure 2. Temperatures measured as a function of time for a typical experiment.
Key: Solid line = TAl; dashed line = TCu; dot-dashed line = Tinlet; dotted line: Toutlet
Figure 2 shows the results of a typical experiment with our setup. The figure also shows the temperatures of the water at the position of the inlet and the outlet. The sample is 1 mm thick Inconel 600 with a thermal conductivity of = 13.0 W/mK. This sample was calibrated at the National Physics Laboratory, UK.
The Al and Cu temperature readings depend on many parameters, among which is the interface resistance: Rth. The other parameters include the material properties and dimensions of the parts of the setup and the exact position of the thermocouples. All of these can be measured independently leaving the thermal resistance as the only unknown.
Numerical Simulation and Data Analysis
To obtain the thermal resistance of the sample from the experiments, the data are fitted using a detailed numerical model of the setup. The authors used the finite element package SEPRAN for the numerical simulation of the experiments. The model utilizes rotational symmetry and is therefore effectively 2D. The measured aluminum temperature is used as a boundary condition on the bottom side of the model. The other boundaries are kept at ambient temperature.
Great care was taken to obtain grid independence of the results. A very fine grid is needed near the edges of the various blocks in order to be able to represent the strong temperature gradients that may occur at those locations. The numerical accuracy of the model has also been tested against analytical benchmarks.
The finite element model is used to find the thermal resistance, Rth, of the sample that minimizes the RMS distance between the measured and computed copper temperature curve. This is actually achieved by optimizing the effective thermal conductivity, eff = d / RthA , of the sample using a simple line optimization method. For the case of ideal thermal contact (no contact resistance) this number should equal the thermal conductivity of the sample. For non-ideal contact, which is normally the case, it is not possible to deduce the thermal conductivity from one single experiment. We will return to this topic in the next section.
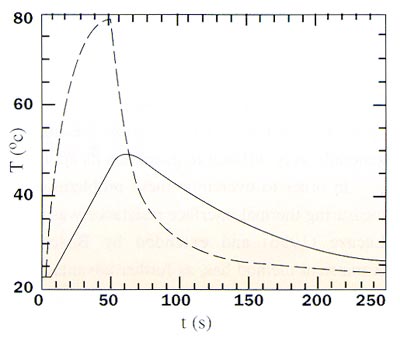
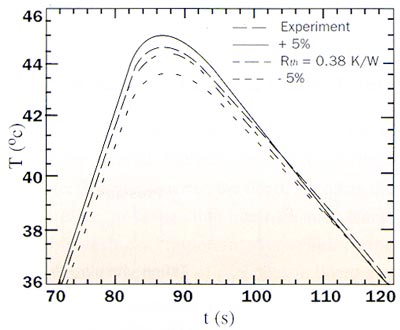
The result of a fit is shown in Figure 3 for the same experiment as in Figure 2. Literature values for the material properties have been used, resulting in a fit that is always within 0.1oC of the measured curve. The value of the thermal resistance corresponding to the best fit is Rth = 0.38 K/W. This value is reproducible to within 0.02 K/W between experiments, when the sample is removed in between experiments.
Figure 3a. This graph is an example of a fit using the finite element model. The measured aluminum temperature, Tal,exp (dashed line) is used as a boundary condition for the numerical model. The dot-dashed line shows the measured copper temperature, and the solid line shows the computed copper temperature.
Figure 3b. This graph illustrates the sensitivity of the fit to the value of Rth. Variations of +/-5% are shown together with the experimental data. Note that these 5% variations are clearly distinguishable, indicating the high sensitivity of the method.
Repeatability of the experiments (i.e., without removing the sample) is even higher. No effort has been undertaken to make the contact resistance reproducible and it is therefore expected that the observed variations are mostly due to contact resistance variations between experiments.
Some Experimental Results
A number of calibrated samples were obtained from the National Physics Laboratory (NPL, UK) and tested in this setup. The authors tested a 1 mm thick Nickel 200 sample, a 1 mm thick Inconel 600 sample, and 1 mm and 2 mm thick Perspex samples. The results of the measurements are presented in Table 1. All samples were tested with dry contact.
Table 1: Measured Thermal Resistances for Calibrated Samples
|
Note: The effective thermal conductivity, eff, differs considerably from the calibrated values,
cal, due to the presence of contact resistances (Rc).
The measured values of Rth can be used to find the contact resistance Rc using
|
where d is the thickness of the sample, A is its area and 2 Rc is the sum of the contact resistances on both sides. is the calibrated value of the thermal conductivity, also given in the table.
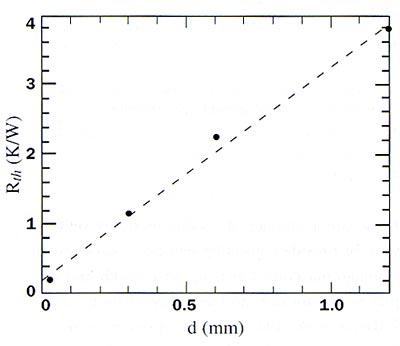
The presence of contact resistance makes a measurement of an unknown thermal conductivity using a single sample impossible. There are three possible ways to circumvent this problem. The first possibility is to try reducing the contact resistance to zero, thus reducing its effect on . The second solution is to ensure that the contact resistance is both reproducible and known. The third option is to have a reproducible but unknown contact resistance and to use a set of samples with varying thickness. Relation (1) may then be used to find both
and Rc.
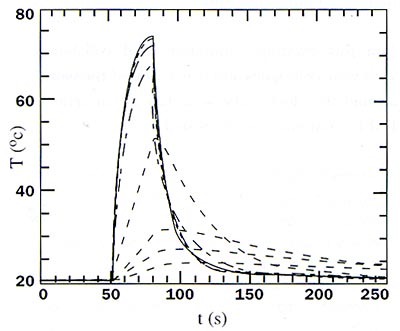
Figure 4a. These plots are measurements for polycarbonate samples of different thickness. This graph shows measured temperatures. (Key: solid lines = TAl; dashed line = TCu😉
Figure 4b shows thermal resistance as a function of thickness. The line corresponds to = 0.257 W/mK and Rc = 0.087 K/W.
The result of an experiment involving four samples of different thickness is shown in Figure 4. From these four experiments it is possible to find the conductivity, = 0.257 W/mK and the contact resistance, Rc = 0.087 K/W. This fit relies on the assumption of reproducibility of the contact resistance, which is justified by the fact that the four points are indeed on a straight line.
For samples that deform under pressure and/or temperature variations, it is necessary to monitor the thickness during the experiments in order to find the thermal conductivity. In a second setup, which is now available, this problem has been solved. This new setup also features a much faster temperature step (making use of jet impingement and a cold plate made of silver) with a much higher thermal diffusivity. Accurate pressure control is achieved by making use of air bearings and known weights.
Conclusions
A measurement facility for transient determination of interface resistances has been discussed, and its potential as a promising alternative to existing steady state methods has been demonstrated. It is shown that the apparatus can detect differences of the order of 0.02K/W (Pentium-size area), while the measurement times are of the order of minutes.
The authors developed a novel way of analyzing the experimental data using a numerical model of the setup. With the help of this method it has been demonstrated that it is possible (but by no means an easy task) to measure thermal interface resistances with an error of 5%. A prerequisite for achieving this accuracy is an equally accurate knowledge of all material properties involved and a detailed knowledge of the influence of other systematic errors (both numerical and experimental).
References
1. Bosch, E.G.T., and C.J.M. Lasance, Accurate Measurement of Interface Thermal Resistance by Means of a Transient Method, Proc. SEMITHERM XVI, San Jose, CA, pp. 167-173 (2000).
2. Lasance, C. and C. Lacaze, A Transient Method for the Accurate Measurement of Interface Thermal Resistance, Proc. SEMITHERM XII, Austin, TX, pp.43-45 (1996).
3. Yovanovich, M., J. Culham, P. Teerstra, Calculating Interface Materials, Electronics Cooling Magazine, vol.3, no.2, pp. 24-29 (1997).

