Peter Rodgers
Fan modelling is one of the most critical aspects of the analysis of forced-air-cooled systems. Lasance [1] summarized the challenges of modeling air movers such as fans and key factors that need to be taken into consideration. Such factors include the need to model the fan hub, and to account for the swirl velocity coefficient.
In addition to the above challenges, Grimes et al. [2] found that vendor fan performance characteristic curves published in manufacturer catalogs can typically be only approximately reproduced by clients under standard conditions, although vendor data is supposed to be generated in accordance with BS Standard 848. This standard specifies an acceptable uncertainty of ± 2 % for all measurements of fan flow.
Furthermore, the potential adverse influence of the operating environment on fan curve performance is often overlooked in numerical work, and is the focus of this article. Constricted installation spaces in electronic systems can result in significant fan performance losses [3-5], as illustrated in for example [3]. To demonstrate the potential significance of this oversight, the results of a computational fluid dynamics (CFD) benchmark undertaken for a mock-up telecommunication system to assess the accuracy of fan curve modeling is presented.
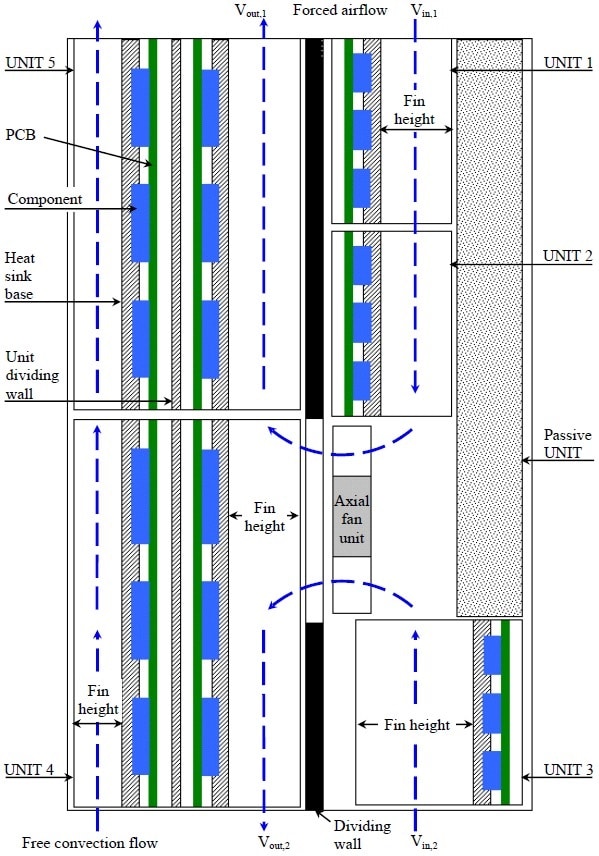
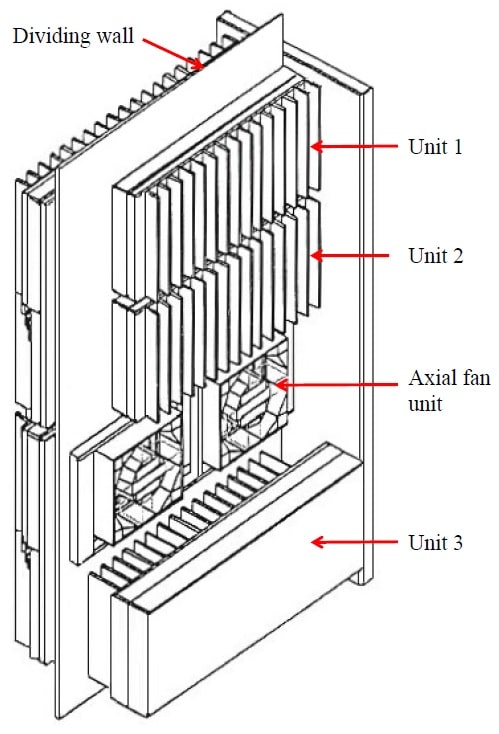
As shown in Figure 1, the system is comprised of five mock-up heat dissipation units (designated as Units 1 to 5), each having a printed circuit board (PCB) assembly mounted to a heat sink. PCB heat dissipation was experimentally simulated using board-mounted resistors. Units 1, 2, and 3 are comprised of a single PCB-heat sink assembly, whereas Units 4 and 5 both have two PCBs separately mounted to heat sinks.
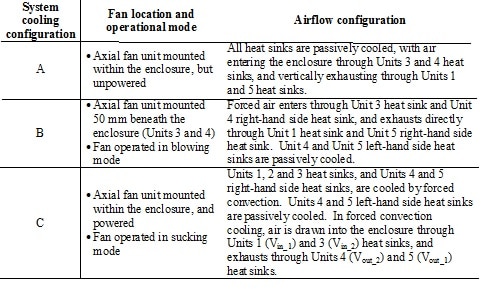
Three system cooling configurations are considered, that are summarized in Table 1. Note that cooling configuration C could be considered as a poor thermal design in terms of fan location, but serves here to illustrate modeling challenges.
(a) Side view, illustrating airflow for cooling configuration C (b) Exploded view (with cabinet cover and passive unit removed from (a))
Figure 1: System geometry and internal airflow patterns.
Table 1: System cooling configurations.
System cooling configuration Fan location and operational mode Airflow configuration
*Note: The geometry of cooling configurations A, B and C is shown in Figure 1.
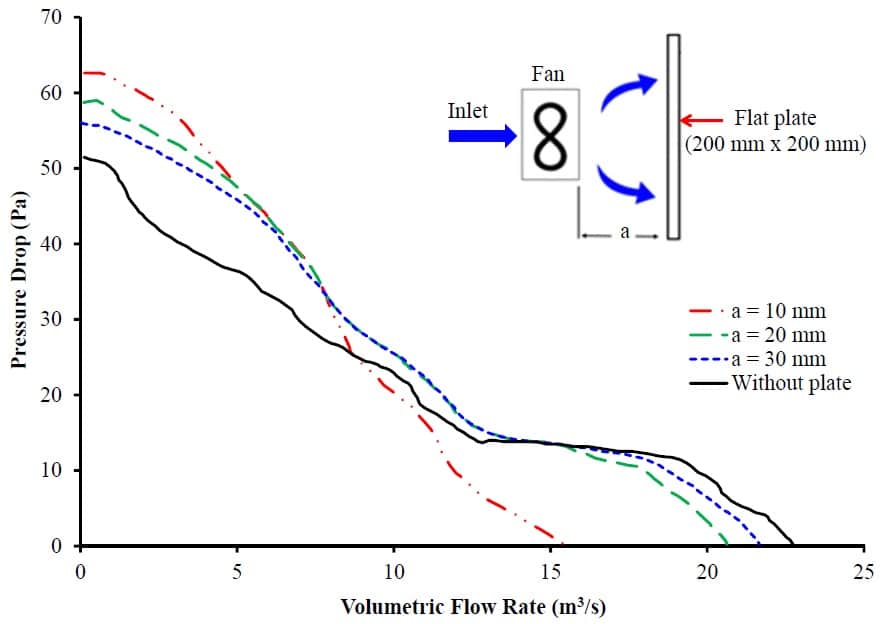
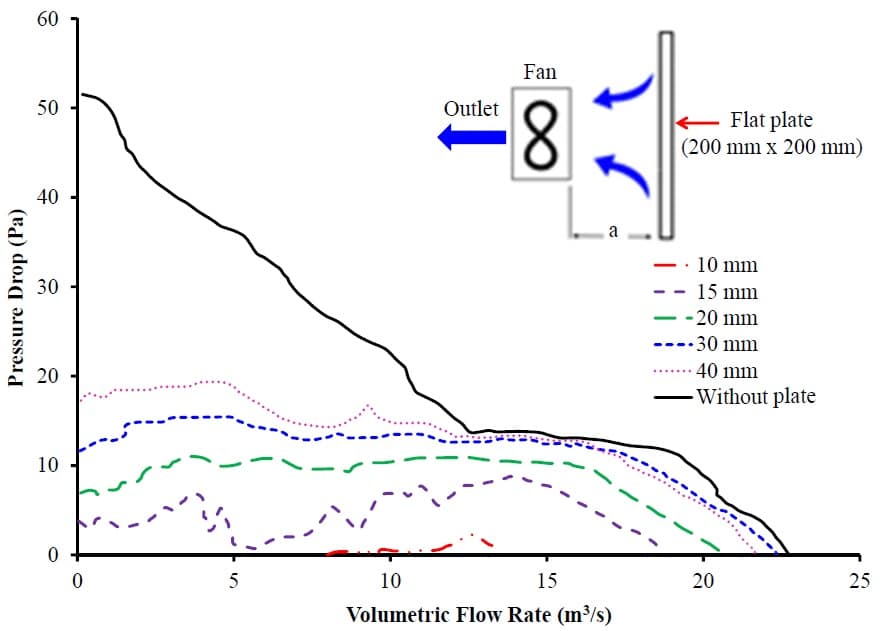
For cooling configuration C, the influence of the restricted environment on fan performance requires to be considered. In the absence of a physical prototype, the fan performance curve was obtained from the vendor and was generated in accordance with BS Standard 848. In addition, the influence of a single 200 mm x 200 mm flat plate obstruction mounted at varying distances from the fan, ranging from 10 mm to far field, on either the pressure or suction side, as illustrated in Figure 2, is assessed. As expected [3], the suction side is found to be more sensitive to the presence of an obstruction than the pressure side.
The airflows entering and exiting the system enclosure were measured using hot wire anemometry to determine fan flow rate. Operating temperature was measured in steady state conditions at selected locations, and the electrical power dissipated as heat by each unit was also measured. These latter two measurements combined permitted the calculation of the unit thermal resistance.
(a) Pressure side analysis
(b) Suction side analysis
Note: a = separation distance between fan and flat plate obstruction.
Figure 2: Measured change in axial fan performance characteristic curve caused by the flat plate obstruction.
A complete system level CFD model was constructed using an industry standard software for each of the three enclosure cooling configurations in Table 1, and was validated for individual units using experimental measurements conducted in wind tunnel and still air enclosures. For each of the three enclosure cooling configurations, the model predictive accuracy is assessed in terms of the measured heat sink thermal resistance and fan flow rate.
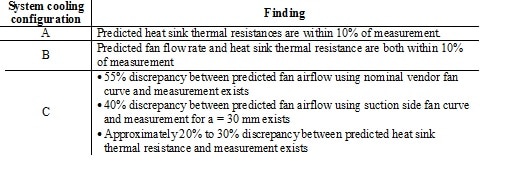
As shown by the results presented in Table 2, very good agreement was found between numerical predictions and measurements for cooling configurations A and B. However significant discrepancies in heat sink thermal resistance exist for configuration C, which is attributed to inaccurate prediction of the fan airflow rate.
Table 2. Discrepancy in unit thermal resistance between numerical predictions and measurements.
Summary
This article illustrates that without supporting measurements, predicting complex system thermal performance is a challenge because of the non-availability of accurate fan flow modeling data, applicable to the system geometry and cooling configuration under analysis. The accuracy of the CFD software itself is unlikely to be a significant source of error in this instance.
References
[1] Clemens J. M. Lasance, The Conceivable Accuracy of Experimental and Numerical Thermal Analyses of Electronic Systems, IEEE Transactions on Components and Packaging Technologies, Vol. 25, No. 3, 2002, pp. 366-382.
[2] Grimes, R., Davies, M., Punch, J., Dalton, T., and Cole, R., 2001, “Modeling Electronic Cooling Axial Fan Flows,” Transactions of the ASME, Journal of Electronic Packaging, Vol. 123, pp. 112- 119.
[3] Harmsen, S., “Equipment Fans for Electronic Cooling: Function and Behaviour in Practical Application, verlag modeme industrie, 1991.
[4] Hill, T.B., and Hill, C.H., “Effects of Electronic Enclosure Layout on Fan Performance,” ASME Winter Annual Meeting, Paper Number 90-WA-EEP-6, 1990.
[5] Deiters, T., and Hill, T.B., “Correlation of Experimental Measurements to Computer Modeling of a Forced Convection Cooled Electronics Enclosure, ASME Winter Annual Meeting, Paper Number 91-WA-EEP-36, 1991.

