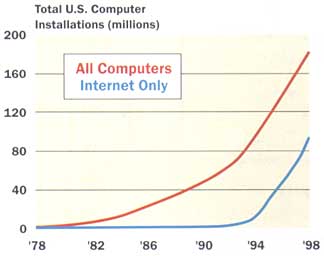
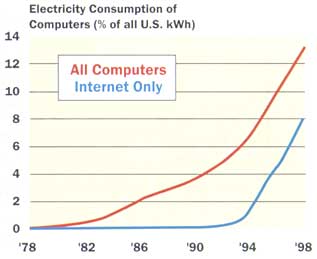
Rapid growth in the use of Internet and telecommunication services has created unique yet critical demands on the power required to energize this network. Continuing market requirements for higher-speed access – coupled with expanding needs for all modes of electronic communications – have resulted in telecommunications systems that exhibit dramatic increases in power dissipation compared to previous systems.
This situation stems from market’s insatiable craving for the telecommunications and computer industries to reduce the Time-to-Information interval. To satisfy this requirement with the current technology, feature downsizing and higher frequencies have become necessities. Since frequency and power are directly correlated, the issue of power with respect to delivery, dissipation and quality has become the focal point of industry concern.
In addition, an equally critical situation involves the delivery of quality power to the electronics equipment. Heavily siliconized user communities demand disruption-free telecommunications, yet, the power hungry embedded electronics upon which these communities depend are extremely sensitive to power fluctuations.
Without quality power, there is an immense risk of catastrophic failure. Since the telecommunications/computing network has evolved into one of the world’s major power consumers, generation and delivery of premium power has become a major point of contention.
The current trend and demand for quality power will continue to rise exponentially as the frequency of electronic systems continues to rise and as the “System-on-Chip” model becomes the rule rather than the exception. Consequently, to ensure uninterrupted delivery of information and services across the globe, both the power and telecommunications industries must join forces to address the need and migrate from centralized to distributed power generation and delivery systems.
In this article, the issue of power generation and distribution is explored with a perspective on the evolution of the electronics and power industries to meet the future challenges of the “silicon-world.”
Introduction
Almost from inception, power dissipation and its adverse impact on electronics have been points of concern for the industry. Whether systems have incorporated vacuum tubes or sophisticated integrated circuits, the consideration of power dissipation and consumption issues has always been an integral part of the design cycle. However, the issue of power has never been so contentious as it is today, mainly due to the rapid migration of industrial societies to a silicon-based culture relying heavily on personal computers and the Internet. The advent of personal computers in the eighties and the subsequent socialization of the Internet have exponentially accelerated our dependence on electronics for conducting our daily routines. And this, in turn, has amplified the role of power generation and delivery in this process.
As the world rapidly electrifies, power consumption and power quality are becoming points of contention between different industries that rely heavily on reliable power to operate dependably. The need for power generation becomes clearer if you consider that over 110 million new PCs were sold in 1999, that Internet traffic has been doubling every 100 days [1], and that the Internet infrastructure (PCs, servers, routers, etc.) which service Amazon.com, Schwab.com and the like, requires one megawatt of power [2]. Currently, the presence of the web requires 13% of the power generated by the U.S. grid and is destined to reach 50% within 10 years. If this rate continues, a billion PCs on the web will impose an electrical demand equal to the total U.S. electric output today. Equally important is the quality of power necessary to ensure “glitch-free” operations of electronic systems.
It is expected that the growth in usage of higher frequency electronic equipment, coupled with the elevated demand for quality power, will mandate significant changes in the offerings of both electronics and power industries. It is the objective of this article to provide a perspective on these issues and how they may evolve in the future.
The History of Power Generation in the U.S.
The U.S. Department of Energy (DOE) has compiled a comprehensive [3] overview of the history of power generation in the US. A synopsis of this work follows. At the turn of the century, vertically integrated electric utilities produced approximately two-fifths of the nation’s electricity. At the time, many businesses (non-utilities) generated their own electricity.
When utilities began to install larger, more efficient generators and more transmission lines, the associated increase in convenience and economical service prompted many industrial consumers to shift from self-generation to the utilities for their electricity needs. Development of the electric motor brought with it the inevitable use of more and more home appliances. Consumption of electricity skyrocketed along with the utility share of the nation’s power generation.
The early structure of the electric utility industry was based on the premise that a central power source – supplied by efficient, low-cost utility generation, transmission and distribution – was a natural monopoly. Because the Sherman Antitrust Act outlawed monopolies in the United States, regulation of the utilities was a necessity to protect consumers, to ensure reliability and to permit a fair rate of return to the utility.
Electric utility holding companies were forming and expanding during this period, controlling much of the industry by the 1920s. By 1921, privately owned utilities provided 94% of total generation, and publicly owned utilities contributed only 6%. At their peak in the late 1920s, the 16 largest electric power holding companies controlled more than 75% of all U.S. generation.
In the following decade, President Franklin D. Roosevelt implemented a New Deal plan to build four hydroelectric power projects to be owned and operated by the Federal Government. He was able to get public power “on its feet.” In 1937, the development of Federal power marketing administration began. Federal electricity generation steadily expanded, providing lower cost electricity to municipal and cooperative utilities.
By 1940, Federal power pricing policy was set; all Federal power was marketed at the lowest possible price while still covering costs. From 1933 to 1941, Federal and other public power installations provided half of all new capacity. By the end of 1941, public power contributed 12% of total utility generation, and Federal power alone contributed almost 7%. Even during the Eisenhower Administration’s policy of “no new starts,” Federal power continued to grow as earlier projects came on line.
For decades, utilities were able to meet increasing demand at decreasing prices. Economies of scale were achieved through capacity additions, technological advances and declining costs, even during periods when the economy was suffering. Of course, the monopolistic environment in which they operated left them virtually unhindered by worries about competition.
This overall trend continued until the late 1960s, when the electric utility industry saw decreasing unit costs and rapid growth give way to increasing unit costs and slower growth. Over a relatively short time, a number of events contributed to the unprecedented reversal in the growth and well-being of the industry: the Northeast Blackout of 1965 raised pressing concerns about reliability; the passage of the Clean Air Act of 1970 and its amendments in 1977 required utilities to reduce pollutant emissions; the Arab Oil Embargo of 1973-74 resulted in burdensome increases in fossil-fuel prices; the accident at Three Mile Island in 1979 led to higher costs, regulatory delays, and greater uncertainty in the nuclear industry; and inflation in general caused, among other problems, interest rates to more than triple.
While the industry attempted to recover from this onslaught of damaging events, Congress designed legislation to reduce U.S. dependence on foreign oil, develop renewable and alternative energy sources, sustain economic growth, and encourage the efficient use of fossil fuels. One result was the passage of the Public Utility Regulatory Policies Act of 1978 (PURPA).
PURPA became a catalyst for competition in the electrical power industry, because it allowed nonutility facilities that met certain ownership, operating, and efficiency criteria established by FERC to enter the wholesale market. Utilities initially did not welcome this forced competition, but some soon found that buying generation from a qualifying facility (QF) had certain advantages over adding to their own capacity, especially because of the increasing uncertainty of recovering capital costs.
The growth of non-utilities was further advanced by the Energy Policy Act of 1992 (EPACT). EPACT expanded nonutility markets by creating a new category of power producers: wholesale generators that are exempt from corporate and geographic restrictions. These transformations eventually planted the concept of distributed power generation in the U.S.
|
Table 1. Power Generation by Fuel, 1995 (Billion Kilowatt-Hours) [3]
|
Table 2. Planned Power Generation Capacity Additions by Year (Gigawatts) [3]
Table 1 captures the essence of the history by highlighting the total power generation per fuel type and the direction of the government to create nonutility providers of power. The data indicates that, in 1995, 11% of U.S. power needs was generated by the non-utilities and coal was playing the major role in overall power generation.
Table 2 highlights the continued demand for power as utilities and nonutilities endeavor to produce more power the meet the ever-increasing demand. Another noteworthy point is that the nonutilities have been playing a more significant role in power production, rising from 11% of the power increase required in 1996 to 28% in 1999.
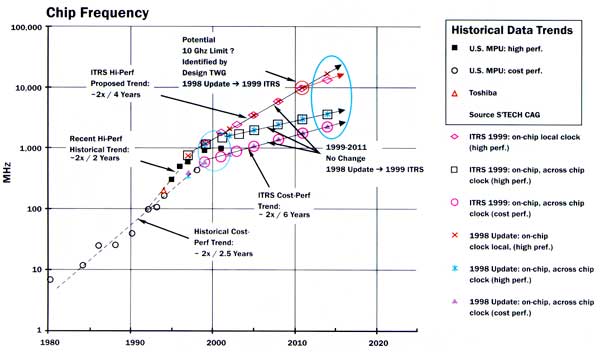 |
Figure 1. Projection of silicon device frequency as a function of time [4].
The Role of Electronics in Power Demand
Across the industry, power dissipation of electronic systems has been rising exponentially, due mainly to higher circuit frequencies. Figure 1 shows the frequency increase with respect to time for silicon-based devices [4]. The data clearly shows that the increasing device frequency will be a critical factor in overall power dissipation.
If we consider Table 3, the role of frequency in device power dissipation becomes clear. Table 3 shows the increase in device gate count as a function of time as well as feature, voltage and power, with the latter having the frequency (MHz) component.
|
Table 3. Gate Count and Date Power Trend for Standard Devices [5]
Power consumption per gate has decreased substantially from 0.64 to 0.15 �W / Gate / MHz. Yet, overall power dissipation has risen dramatically for just about every electronic component type on the market. This phenomenon can be attributed to the increased number of devices on a die (gates/device), as indicated in Table 3 and processing speed, as evident in Figure 1.
A simple calculation demonstrates the effect of speed (frequency) on power dissipation. Suppose we have two devices, 500 MHz and 600 MHz, respectively, with each containing five million parts (gates). If we use today’s technology, the power dissipation will be 0.15 �W / Gate / MHz. Assuming that the entire device is at the same frequency, we can perform a simple algebraic calculation and determine that the power dissipation in such a device is 375 W and 450 W, respectively, for the 500 MHz and 600 MHz devices. Such power dissipation in a spatially constrained environment is, at times, beyond imagination.
|
Table 4. Comparison of Heat Flux between Light Bulb and BGA Package
To gain an appreciation for these power levels and their impact, let us compare a 100W light bulb with a Ball Grid Array (BGA) device that dissipates 25 W (Table 4). The heat flux of a light bulb is approximately 13 times less than that of the BGA. Considering that there are multiples of such devices on a PCB and multiples of such PCBs in a system, it can be anticipated that power dissipation will continue to increase with the device frequency.
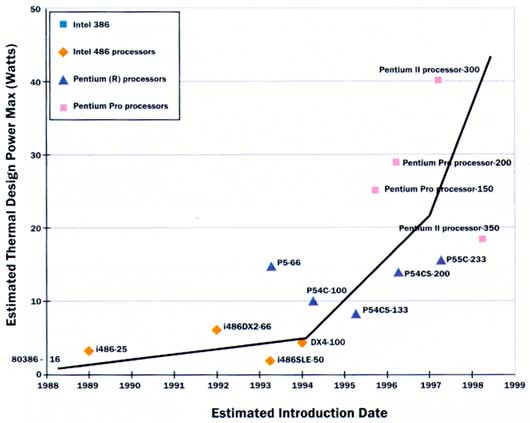 |
Figure 2. Time-line plot of Intel microprocessor power dissipation.
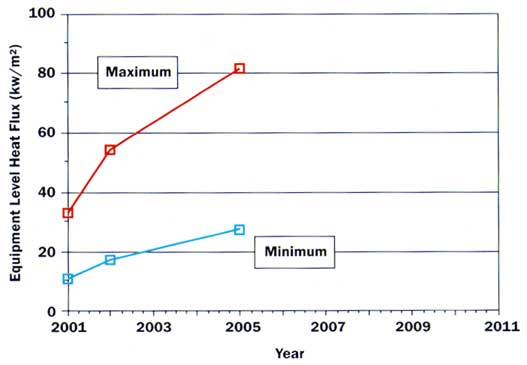 |
Figure 3. Telecommunications and computing system heat flux as a function of time.
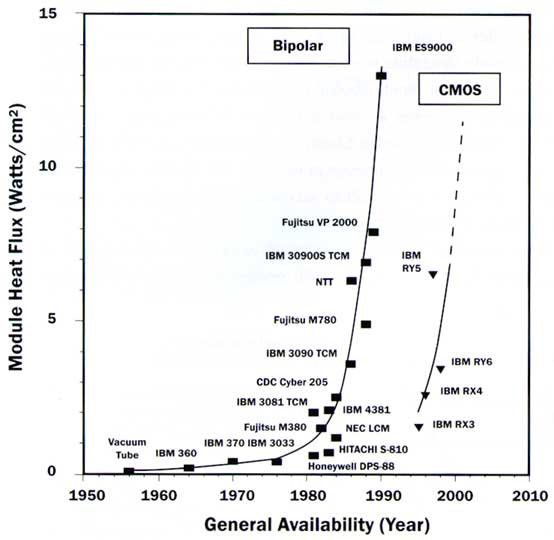 |
Figure 4. Power dissipation trends, comparing Bipolar and CMOS technologies [8].
Figure 2, shows the time-line plot of CPU devices for Intel Corporation [6]. Note the embedded frequency data on this plot as a function of time. Similar to the device trend shown in Figure 2, the system level data shown in Figure 3 suggests a dramatic increase in system heat flux (power generation per system foot print area).
With the current device and manufacturing technologies, all industry beacons point to significant power increases with time. There is nothing in the timeline projections to suggest that device or system level power dissipation is on the decline, nor is power dissipation likely to reach a plateau in the next 5 to 7 years.
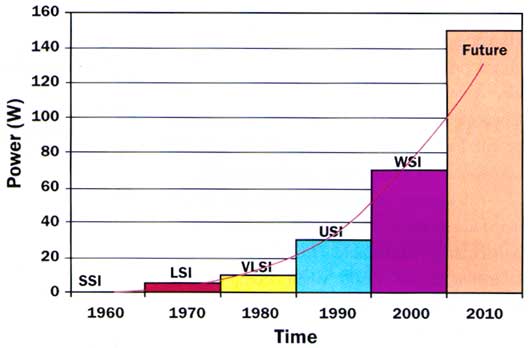 |
Figure 5. Timeline plot of device technology with respect to power dissipation.
Even technological advancements that were once touted as saviors have not shown any degree of promise. Figure 4 shows one such advancement when the electronics industry began to incorporate CMOS technology over Bipolar [7]. The comparison between the two technologies clearly indicates that the newer technology bought the industry only 10 years. As shown, CMOS and Bipolar technologies have paralleled each other with a 10-year time shift. Moreover, Figure 5 illustrates that other packaging technologies ranging from Large Scale Integration (LSI) to Wafer Scale Integration (WSI) have also proven to be power hungry.
Power dissipation, irrespective of the technology, exhibits an exponential growth with time. The history shows that as the demand on functionality has increased, power dissipation has followed suit as well – a serious challenge for the power industry as it seeks to meet these ever increasing demands.
Power Generation and Demand
Barring an unforeseen technological breakthrough in electronics, all industry indicators point to a steady increase in power dissipation. In the early 90’s, with the popularity and ease of access to personal computers and the Internet, a paradigm shift in information processing and delivery occurred. Mass access to electronics — with consumers expecting instantaneous response like turning on a light — forced many companies to provide higher speed systems and services. Higher speed requires more power. From the signal processing point of view, higher speed also necessitates smaller devices and systems. Consequently, generating and delivering quality power has become an integral and essential component of a harmonious silicon world.
|
All aspects of industrial life are putting demands on the power industry. This demand is particularly noticeable from the energy-intensive digital world where computational power is rising faster than bit efficiency. Indeed, half of the U.S. grid will be powering the digital Internet within the next decade compared to 13% today. And if current PC production continues to grow (Figures 6 and 7) and the number of PCs connected to the Internet reaches one billion, then the power required to support this infrastructure will equal the total U.S. electrical output today.
The issue is so controversial that it has even drawn politicians into the fray. The absolute magnitude of the percentage increase – whether 8, 13 or 50% – will be argued indefinitely. There is even a counter argument that the digital phenomenon has actually helped reduce the demand on the power grid, though there is much evidence to the contrary, for instance, the explosion of wired and wireless services.
Another example is the report by Matthew Jones [8] on the power demand for London’s data centers. He says, “Internet hotels, sometimes known as ‘telco hotels’, house file servers and other essential information technology hardware for web-based businesses. The trend for increasingly large centers is driven by rising Internet use and companies’ needs to improve the reliability of their sites. The vast data centers, each expected to cover an area of up to 50,000 square meters, will require enough electricity to power two cities the size of Bristol. Much of the energy will be used to power the water coolers needed to avoid overheating of the servers. Silicon Valley in California, the world’s greatest concentration of new economy businesses, is already struggling to cope with the impact of the Internet hotels springing up around San Jose. Last month Pacific Gas and Electric Corp, the region’s largest utility, was forced to cut power at short notice to 97,000 customers to avoid overloading the network. Up to now, London Electricity, the capital’s power distribution company, has been able to cope with the increase in demand. But industry experts warn that private power plants may have to be built to accommodate the scale and speed of Internet hotel construction in the next four years.”
With all the evidence around, highlighted by the growth of electronics in every facet of today’s life, it is quite apparent that power generation will remain a major point of contention. As mentioned earlier, Internet, data, voice and video communications all have substantial roles in overall power consumption. The Internet alone consumes half of the U.S. production, which grows 3% a year, and affects all areas of communication. This includes telecommunication central offices, wide area networks, business communication equipment, computer and broadcast systems, financial institutions that are data-communication intensive, and even medical facilities that are becoming data- and video-communication intensive.
To further corroborate this argument and get a simple measure of the energy requirement to power the digital world, it is prudent to compare the power requirement of narrow and broadband services. Narrowband requires 0.5W of power per average line and 1W peak per line versus the highly sought after broadband, which requires 5W per average line and 10W peak per line. There is, thus, a factor of 10 difference between the two types of telecommunication services. Simply multiply this by the potential number of users in the U.S. alone, and you arrive at a measure of the challenge facing the power industry.
The Relationship between Power and Electronics Industries
The interdependency between the power and electronics industries grows stronger with every passing year. Because of the demand for quality – or “premium” – power, the infrastructure of the power industry must evolve.
By definition, premium power provides stable levels of noise-free voltage to end-users. This is quite important, as U.S. businesses lose $26 billion annually because of power disturbances. This amounts to $100 per man, woman and child in this country alone. Furthermore, 40% of all delivered power supports equipment that requires some level of premium power. By the end of 2000, this is anticipated to grow to 65%, more than a 50% increase in one year with respect to the previous year [9].
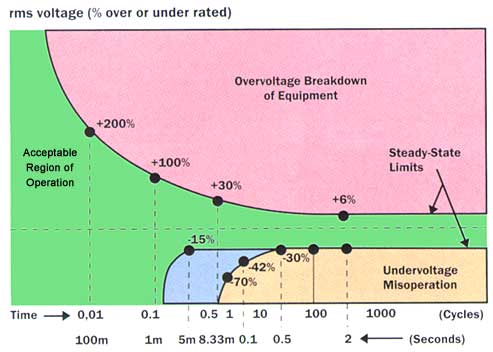 |
Figure 8. Typical computer and other microprocessor-based equipment voltage tolerance envelopes.
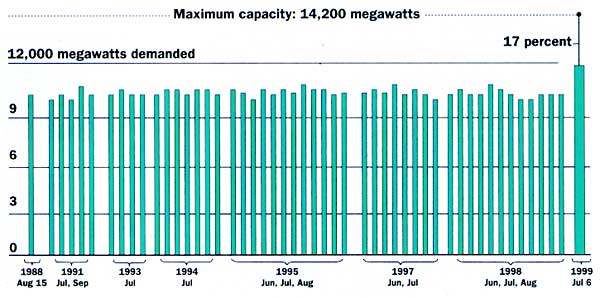 |
Figure 9. Available level of power before catastrophic failure.
Figures 8 and 9 depict how critical the delivery of premium power is. Figure 8 shows the voltage tolerance envelopes for typical computer and other microprocessor-based equipment as a function of the disturbance time (under- or over-voltage of supplied power).
Figure 9, shows the timeline of power production in the city of New York during 1998 and 1999 for the summer months. The data illustrates that during peak demand (3-day heat wave), the system capable of producing 14,200 megawatts came within 17% of maximum capacity. If the heat wave had continued – considering the safe operating envelope shown in Figure 8 – the inability to deliver premium power would have had a devastating effect on electronics equipment connected to that power grid.
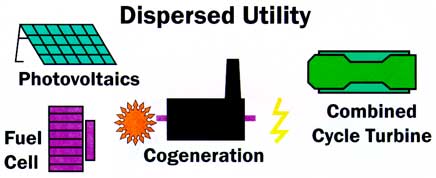 |
Figure 10. Energy technology options for distributed premium power generation.
Distributed Power Generation
Providing premium power to the digital world will force major changes in both power generation and electronics industries. With the tolerance for voltage fluctuations diminishing steadily, both industries have little alternative but to decentralize. Distributed computing along with power generation should become the trend of choice rather than the exception. In this venue, alternate sources of energy generation and delivery must be explored to ensure availability of premium power to microprocessor-based electronics. Many old and emerging energy technologies are being investigated to address this very issue. These include photovoltaics, micro-turbines, fuel cells, flywheel and hydro-energy, to name a few. Figure 10 shows the diversity of energy technologies being explored.
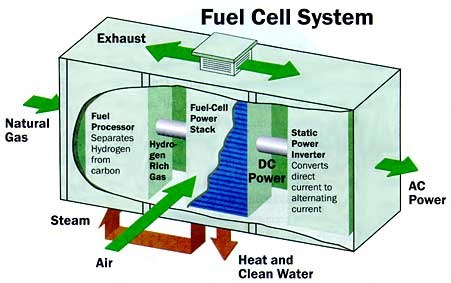 |
Figure 11. A fuel cell-based power plant system. (Source: ONSI, Sure Power, Con).
Although fuel cells have higher installation costs than a traditional power plant, they are emerging as a strong candidate for providing distributed power. The elements that make fuel cells attractive are consistent flow of electricity (99.99997% of the time), 80% efficiency, 25% lower operating cost and reduced environmental impact. Figure 11 shows a typical fuel cell system.
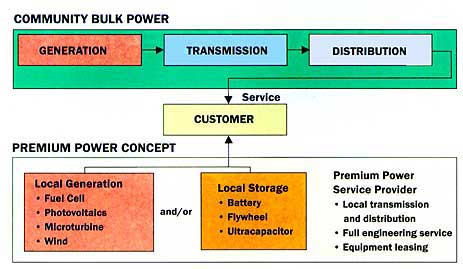 |
Figure 12. Comparison of distributed and centralized power distribution.
From the previous discussion and data presented, it should be apparent that centralized power distribution and generation will become bottlenecks to the future growth of the silicon-world. However, there is reason for optimism in the concept of distributed power systems, as shown in Figure 12. The distributed power system delivers some winning advantages:
- No transmission lines — Since generation and delivery of the service is near the point-of-use, the need for transmission line will be eliminated.
- Premium power — Because of the technology used, e.g., fuel cells, premium power can be generated close to the point-of-use, increasing service reliability and significantly reducing the adverse environmental impact created by the current centralized system.
- Improved environmental performance — Distributed power generation technology is much cleaner and more environmentally friendly than the current centralized system.
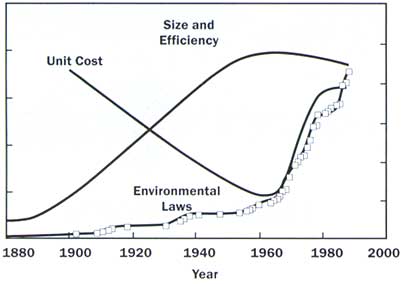 |
Figure 13. Effect of environmental regulation on the power generation industry.
The latter point merits further elaboration. Consider the data presented in Table 1.
In 1995, 88% of U.S. power was generated by environmentally unfriendly methods. Here, 51% was generated by coal, 17% by petroleum by-products and 20% by nuclear reaction. Figure 13 presents a timeline that shows the effects of environmental laws on the power industry as governmental efforts attempt to curb the potential damage caused by centralized power generation. It indicates that laws enacted by governments around the world to control power plant pollution and to safeguard the environment have directly impacted power costs and the size of the power generating entities. Considering that the demand for power is rising exponentially, the adverse environmental impact of traditional power generation methods could be devastating and possibly irreversible.
Summary
As the world grows more digitally focused, the challenges of power generation and consumption will surely become more persistent and difficult to overcome with traditional power generating approaches. This is especially troubling since such approaches also pose significant environmental hazards. As a consequence, it is vital to find new sources of power that are safer and cleaner, while also being more dependable.
The responsibilities for effectively managing power resources and protecting the environment must inevitably be shared by those entities that create the power, by those that build the products and systems which run on the power, and, ultimately, by those that consume the power.
We know that the frenzy and market demand for instantaneous digital service will not diminish. The prediction is that until “the delivery of data on the Internet is as fast as the delivery of electricity to the ceiling light when the switch is turned on,”[10], we in the design community will be forced by market pressures to deliver ever-faster systems. To satisfy this rapidly growing need for electricity in the U.S. and elsewhere, we have no choice but to “design smarter” and exploit new facets of technology to become more efficient in both power generation and consumption.
We know too that the sensitivity of electronic systems to power fluctuations and their requirements for premium power will force major changes in the power industry. This will be led by telecommunications and computing centers which will strive to produce and deliver their own power locally, and thereby create a distributed power network as an alternative to the current centralized power distribution and generation system.
References
1. Time Magazine, Jan 2000.
2. Forbes Magazine, May, 1999.
3. U.S. Department of Energy,
“A Brief Historical Overview of the Electric Power Industry,” Chapter 2.
4. Allen, A., “Digital Silicon Technology,” NEMI Workshop, VA.
5. Lucent Technology Microelectronics Data Book
6. Colwell, R. “CPU Power Challenges 1999”, ISPLED ’99
7. Chu, R.C., Simons, R.E., and Chrysler, G.M., “Experimental Investigation of an Enhanced
8. Jones, M., “‘Internet Hotels’ Threaten to Sap London’s Power,” Financial Times,
July 30 2000.
9. Morabito, J. ” Power Generation Issues in the Telecommunications and Electronic Industries,” Lucent Technologies, Thermal Design Forum, Sept. 1999.
10. Azar, K., “Power Consumption

