Today it is commonly accepted that dynamic thermal measurements, which have been used for more than 20 years [1], [2], [3], [4], are superior to steady-state ones. The temperature vs. time function – often called the thermal step-response function, heating curve, or thermal impedance curve – is characteristic of the chip-to-ambient structure, including even different cooling and assembly mounts. In other words, by measuring the thermal dynamics at the junction, we can gather all information about the geometrical and material properties of the chip surroundings, and then, by appropriate evaluation, we can gain insight into the measured thermal structure.
Dynamic Temperature Measurement Methods
The most common thermal transient measurement method is the classical electrical temperature measurement [5] in which a temperature sensitive parameter (TSP) of the semiconductor device-under-test is used to monitor the temperature rise. Such a TSP is, for example, the change of the forward voltage of a diode (pn junction) biased by a constant current. In this method, a dedicated test equipment – termed by different vendors as a thermal transient tester [6], thermal analyzer [7] or thermal test system [8] – is usually used to control the applied excitation power and to carry out the temperature measurement as accurately as possible. This measurement method provides the best time resolution and temperature accuracy (commercially available products provide 1 �sec and 0.01oC, respectively).
A similar approach uses thermal transient measurement chips (TTMC-s) [9], [10]. In this rather simple measurement setup, the encapsulated TTMC is connected to a D.C. supply unit and a computer. The test chip is equipped with dissipators and digital output temperature sensors and with the control logic necessary for interfacing it to the PC. The measurement software on the PC switches the dissipators on and off, selects a sensor for measurement, and continuously reads out the temperature data from the chip. With this scheme, a time resolution of 300 �sec and a temperature measurement accuracy of 0.01oC can be achieved [10].
As a third option, we mention capturing infrared image sequences of the package surface. Note, that the excitation occurs in the chip, inside the package, thus, with this method we always obtain thermal transfer impedances.
Alternatives in Dynamic Temperature Measurement Using the Classical Electrical Method
Performing an accurate transient measurement using a TSP is usually a difficult task. The commonly used diodes, for example, have only two terminals, and these must be used for heating the device as well as for measuring the change in the forward voltage. To solve this measurement problem, two methods are used:
- In the classical case, one applies a forward current pulse providing power to heat the diode, then an appropriately small sensing current is switched to the device for measuring the forward voltage. Knowing the diode’s calibration curve at low current levels, one can convert the measured voltage into temperature. The major advantage of this method is that the measurement takes place in a small voltage range, corresponding to the sensing current and the expected temperature rise. The complete heating curve is composed of a series of such pulse measurements. In the following sections, this method is called pulsed measurement. The time resolution of complete heating curves composed this way depends on how the measurement pulses follow one another. The typical number of recorded data points is from 50 to 100.
- As an alternative, if one can derive the temperature characteristics of the diode for both high and low operating currents, the continuous change of the temperature can be monitored on-the-fly, in real time, without switching between the heating and sensing currents. Consequently, the complete heating (or cooling) curve can be recorded at once, without any overhead in measurement time. Another advantage of measurement on-the-fly is that – since switching from the heating current to a sensing current is avoided – the measured change of the voltage across the device corresponds to the temperature at a given time instant, without any disturbance. The temperature measurement accuracy depends solely on the accuracy of the measurement of the voltage change. Since trade-offs related to the sensing current are avoided, temperature measurement accuracy can be higher, by at least one order of magnitude, than the typical 0.3oC accuracy of the pulsed measurement method. The on-the-fly measurement of a diode’s heating curve, of course, must be preceded by a setup procedure where the pulsed method is used for device calibration (also low temperature at high operating currents) and for identifying the appropriate measurement range. This “pulsed” process is a single preparatory step for any number of subsequent on-the-fly transients. Such a calibration process allows one to avoid severe electrical interference during real-time measurements.
Calibration, Figure of Merit
The device calibration in either transient measurement method is the same: for diodes the K-factor of the Tj = K � VF + T0 equation needs to be identified, where Tj denotes the junction temperature, VF is the junction forward voltage and T0 is the temperature offset. Since it is the temperature change that is interesting from the point of view of evaluating heating curves, T0 can be neglected. This means that calibrating the measurement channels of the test equipment is less crucial, since high accuracy is required in measuring voltage changes only.
In addition to the usual signal-to-noise ratio (SNR), capabilities of a thermal transient measurement setup can be described by a figure of merit that is defined as follows: FM = Pmax / temp where
temp denotes the smallest change of temperature that can be measured (i.e. the temperature measurement resolution) and Pmax is the highest power level that can be applied to a DUT (device under test). The figure of merit is related to the signal-to-noise ratio through the R
ja of the DUT as follows: SNR = FM � R
ja. Strictly speaking, this relation can be applied only if nonlinear effects (natural convection, radiation) are negligible. A high value of the figure of merit means that accurate heating curves can be obtained even at moderate dissipation levels. Commercially available test equipment provides an FM value in the range of 1000 to 10,000 W/K.It is worth noting that the amount of information contained in a measured thermal transient curve is independent of the level of the applied heating power. Thus, with a high figure of merit, accurate thermal transient response functions can be obtained even with relatively low power levels. High heating power is important only if thermal characterization and reliability analysis of a device must be performed at the same time.
Evaluation of Dynamic Temperature Measurement Results
Evaluation techniques of thermal transient measurement results are typically linear. Either they are based directly on linear network theory [2], [11] or they result in linear models, such as presented in [3]. Furthermore, linear behavior is presumed for both the investigated structure (the package) and the temperature sensor element.
This is a point where a high figure of merit for the measurement is important: In order to avoid, for example, the effect of temperature dependence of thermal properties of structural materials in a heat-flow path, the temperature rise should remain relatively small. If this is the case, evaluation procedures result in models where the effect of the non-linearity of the DUT’s material properties and of the non-linearity of the sensor element is negligible.
Of course, a high figure of merit does not exclude using high power levels for recording heating curves of high nonlinearity.
Example I: Generation of Non-Linear Compact Models
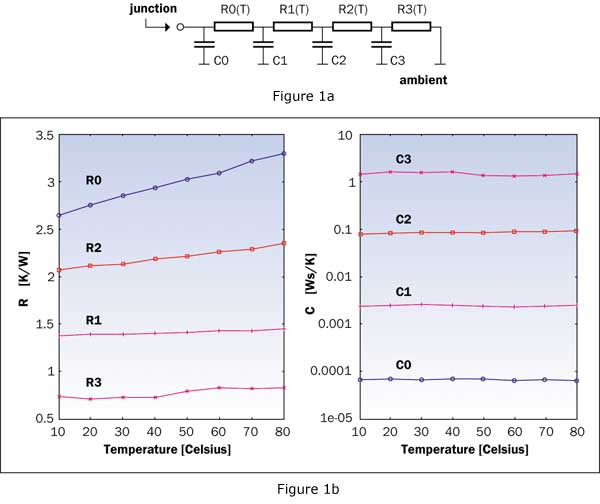
In order to collect information about the temperature dependence of package models, the same structure – a BJT (bipolar junction transistor) – was measured while the ambient temperature was varied between 10oC and 80oC in steps of 10oC. During the measurement, to assure linearity, the temperature rise was limited to 20oC. From every measured heating curve a 4-stage linear RC (resistance-capacitance) model of the junction-to-ambient heat-flow path was extracted by the NID (Network Identification by Deconvolution) method [11] (See Figure 1a). By changing the ambient temperature for consecutive measurements, temperature dependent material properties are also changed. In this way, by extracting the same kind of ladder model from every measured heating curve, the temperature dependence of the element values was identified (Figure 1b).
Figure 1. Temperature dependent compact model: a) 4-stage RC (Resistance-Capacitance) ladder model of the junction-to-ambient heat-flow path; b) Temperature dependence of the element values of the model.It is obvious that different regions in a heat-flow path have different temperature dependences since they are made of different materials. In our example, resistors R0 and R2 had a high temperature dependence while the heat capacitances remained nearly constant. This suggests that there are at least two regions in the heat-flow path where the thermal conductivity is rather temperature dependent.
Structure Functions: Maps of the Heat-Flow Path
The 4-stage RC model shown in Figure 1a already gave a rough map of the path followed by the heat-flow, which was assumed to be essentially one-dimensional (including, for example, radial spreading). If the ladder had more stages, we would have an even finer map of the path. Since a long RC ladder model is very hard to interpret, the notion of structure functions was introduced [2]. Instead of considering a Cauer-type RC ladder of about 100-200 stages (Figure 2b), it is better to plot the so-called cumulative structure function (Figure 2a).
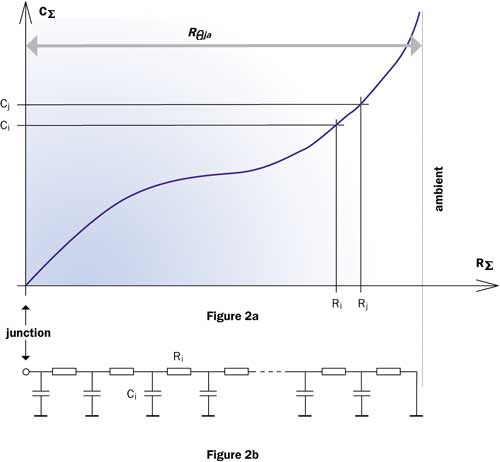 |
Figure 2. The cumulative structure function and a Cauer-type ladder model as it discretized version.This represents the C sum of the thermal capacitances as the function of the R
sum of the thermal resistances of the thermal system (along the long ladder – i.e., the heat-flow path), measured from the point of excitation (junction) towards the ambient. The derivative of the C
(R
) cumulative structure function is the differential structure function, or simply the structure function:
 |
It can be proved [2], [12], [13] that K = cA2 where c is the volumetric heat capacitance,
is the thermal conductivity and A is the cross sectional area of the heat flow-path. In other words: the differential structure function provides a map of the squared cross sectional area of the heat current-flow as a function of the cumulative resistance. In such functions a local peak represents reaching a high conductivity material or a large cross-section in the heat-flow path.The distance of peaks on the horizontal axis gives the partial thermal resistance between such regions.To derive both types of structure functions from measured heating curves, high time resolution (200 to 500 samples/octave on a logarithmic time scale) and highly accurate temperature samples are required. This latter, once again, is strongly related to a high FM value.
Example II: Investigation of Interface Resistance by Using Structure Functions
To demonstrate the application of the structure functions, we present the following example: A power BJT was mounted to a large cooling fin made of aluminum. Four cases for the thermal interface were studied:
- BJT mounted directly to the heatsink with thermal grease.
- BJT mounted directly to the heatsink without thermal grease.
- BJT and mica underneath mounted with screw strongly tightened.
- BJT and mica underneath mounted with screw loosely tightened.
This test structure together with the measured heating curves is shown in Figure 3.
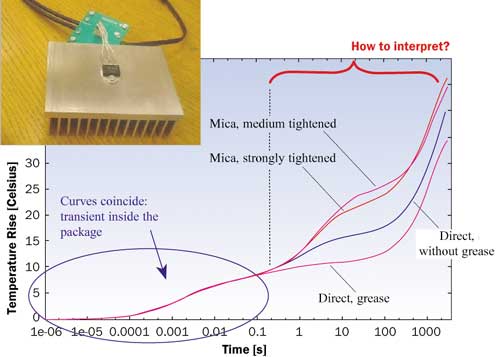 |
Figure 3. Study of the thermal interface between BJT (bipolar junction resistor) package and a cooling fin. The measured transient curves are hard to interpret properly.Initial parts of the four curves coincide. They correspond to the heat-flow inside the package, but it is hard to interpret the right side of the curves. Although the curves show the expected trend generally, the two cases with mica intersect. In order to clearly understand the properties of the heat-flow path, the structure functions of the four cases have been calculated using the method outlined in the preceding section: Structure Functions: Maps of the Heat-Flow Path.
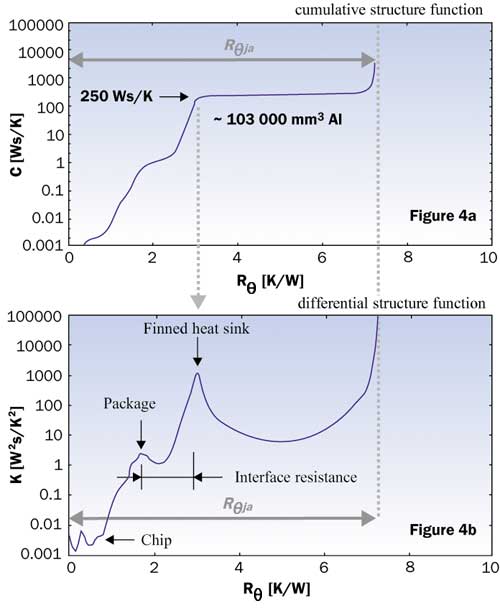 |
Figure 4. Structure functions of the BJT – finned heatsink system (no grease, no mica case); a) The cumulative structure function obtained as explained in Figure 2; b) The differential structure obtained as given by equation (1).Figure 4 shows both the cumulative and the differential structure function for the “no grease” case. The large peak on the right hand side of the differential structure function corresponds to the heatsink. This statement can be verified in the cumulative structure function plot (Figure 4a): The thermal capacitance read at the R value corresponding to the peak location (approx. 3.1 K/W) is 250 Ws/K, which yields a volume of about 103,000 mm3 if we calculate with the volumetric thermal capacitance of aluminum. This estimated volume is very close to the real volume of the fin, which was 115,000 mm3. The other significant peak on the left (Figure 4b) corresponds to the package body of the BJT. This can be verified in the same way. The distance of the two peaks yields the package-to-heatsink interface thermal resistance.
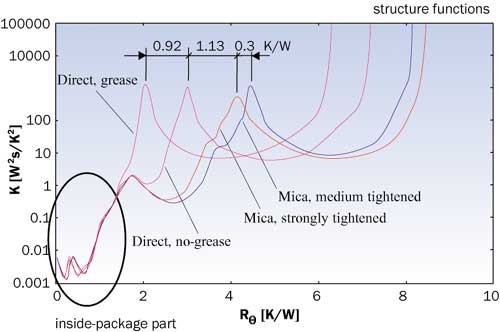 |
Figure 5. The differential structure functions of the four cases. The distance between the peaks corresponding to the heatsink gives the increase of the interface thermal resistance.In Figure 5, the differential structure functions for all four cases are shown in the same plot. This diagram is easy to interpret now: As the package-to-heatsink thermal interface resistance is increased (direct mounting with grease, direct mounting without grease, mica underneath with tight screw, and mica underneath with loose screw) the peak corresponding to the heatsink shifts to the right, resulting also in an increased total Rja.It can be clearly seen that the grease has reduced the interface resistance by 0.92 K/W while the mica (with the mounting screw strongly tightened) increased the interface resistance by 1.13 K/W. As expected from the measured heating curves, the left hand side of the four structure functions coincide, since this portion of the curves describes the heat-flow inside the BJT package.
Conclusions
Thermal transient response functions can be obtained by different measurement methods. In order to derive detailed information regarding the junction-to-ambient heat-flow path, high time resolution and accurate dynamic temperature measurements are needed. Heating curves with high resolution and accuracy can be turned into structure functions that give an insight into the details of packages and cooling mounts. Using structure functions, even partial thermal resistance and interface resistance values can be identified [12]. A high figure of merit also allows the application of relatively small power changes for measurements, assuring the assumed linearity during results evaluation. This also helps in constructing temperature dependent non-linear compact models.
References
- Siegal, B. S., “Measuring Thermal Resistance Is the Key to a Cool Semiconductor”, Electronics, Vol. 51, 1978, pp. 121-126.
- Sz�kely, V., and Bien, T. V, “Fine Structure of Heat Flow Path in Semiconductor Devices: A Measurement and Identification Method”, Solid-State Electronics, Vol.31, 1988, pp. 1363-1368.
- Sofia, J. W., “Analysis of Thermal Transient Data with Synthesized Dynamic Models for Semi-Conductor Devices”, IEEE Transactions on Component Packaging & Manufacturing, Vol.18, No.1, 1995, pp. 39-47.
- Oliveti, G., et al., “Analysis of Laser Diode Thermal Properties with Spatial Resolution by Means of the TRAIT Method”, Microelectronics Journal, V.28, No.3, 1997, pp. 293-300.
- Sofia, J. W., “Electrical Temperature Measurement Using Semiconductors”. ElectronicsCooling, Vol.3. No.1, 1997, pp. 22-25.
- www.micred.com/t3ster.html
- www.analysistech.com/Thermal_Analyzer_Introduction.htm
- www.thermengr.com/tea53.html
- Sz�kely, V., et al.,”New Way of Thermal Transient Testing”, Proceedings of SEMITHERM XV, San Diego, CA, USA, March 9-11, 1999, pp. 182-188.
- Poppe, A., et al., “Design Issues of a Multi-Functional Intelligent Thermal Test Die”, Proceedings of SEMI-THERM XVII, San Jose, CA, USA, March 20-22, 2001, pp. 50-57.
- Sz�kely, V., “Identification of RC Networks by Deconvolution: Chances and Limits”, IEEE Transactions on Circuits and Systems-I. Theory and Applications, Vol. 45, No. 3, 1998, pp. 244-258.
- Rencz, M., et al., “Determining Partial Thermal Resistances with Transient Measurements and Using the Method to Detect Die Attach Discontinuities”, Proceedings of SEMI-THERM XVIII, March 10-14, 2002, San Jose, CA, USA, pp. 15-20.
- www.micred.com/strfunc.html

