In most cases today thermal design for electronic products is performed with the aid of sophisticated computational fluid dynamics and heat transfer codes. Nonetheless, there may still be occasions when a thermal designer needs a quick estimate of the external thermal resistance of a package or heat sink that does not warrant the use of powerful computer codes. In such cases an almost intuitive two-resistor heat flow model is often used.
 |
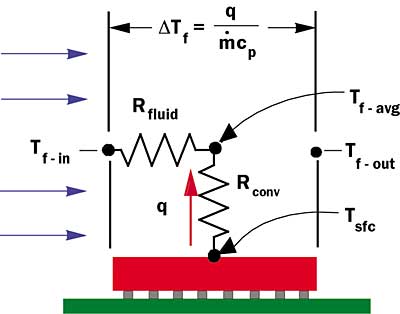
Figure 1. Simple two-resistor thermal model for heat transfer from
a heated surface to cooling fluid flowing over the surface.
As depicted in Figure 1 such a model comprises a convective thermal resistance, Rconv, and a caloric or apparent fluid thermal resistance, Rfluid, which are combined in series to represent the thermal resistance to heat flow from the package or heat sink surface to cooling fluid at the inlet. The package surface or heat sink base temperature, Tsfc, is then given by:
where Tf-in is the fluid inlet temperature and q is the heat flow rate. The convective thermal resistance is simply given by:
 |
where h is the heat transfer coefficient and A is the effective area for heat transfer from the surface of the package or heat sink to air.
The convective thermal resistance is assumed to be between the temperature at the surface (which is treated as if it is isothermal) and the average bulk temperature of the fluid flowing over the surface. Invoking the first law of thermodynamics (i.e., conservation of energy) the average bulk temperature of the fluid, Tf-avg, is equal to the inlet fluid temperature plus one-half the total temperature rise in the fluid as given by
 |
where is the fluid mass flow rate and cp is the specific heat at constant pressure of the fluid. Accordingly, the thermal resistance of the fluid (Rfluid) is 1/2
� cp.
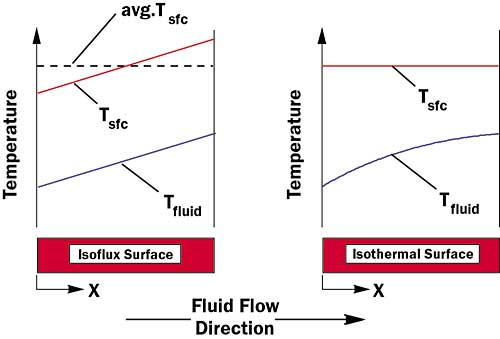
Although the heated surface has been treated as isothermal, strictly speaking, the model presented above is only true for an isoflux surface. To understand why this is so, it is necessary to consider the temperature profiles that will result depending upon whether the boundary condition at the fluid-surface interface is one of uniform heat flux or one of uniform temperature. An example of the variation in the surface temperature and the average bulk temperature of the cooling fluid as it passes over the heated surface is shown in Figure 2 for both the isoflux and the isothermal boundary conditions.
Figure 2. Comparison of temperature profiles with cooling fluid passing over isoflux and isothermal heated surfaces.
For the isoflux case the heat input per unit area is constant as the fluid moves along the surface. As a result, the rate of increase in the average bulk temperature of the cooling fluid with respect to flow length X is constant as it moves along the surface, resulting in a linear temperature profile for both the fluid and the surface. In this case the average surface temperature is exactly that given by equation (3). For the isothermal surface case, as the fluid moves along the surface and heats up, the temperature difference between the surface and the fluid will begin to decrease and so will the heat flux at the surface.
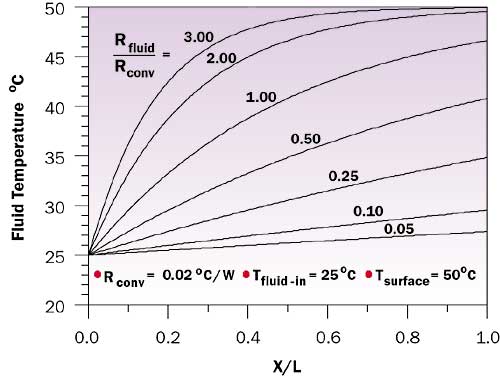
Examples of the cooling fluid temperature profile in the axial direction of flow over an isothermal surface are shown in Figure 3. These profiles are based upon results obtained using a simple finite difference model. For the model it was assumed that the inlet fluid temperature is 25°C and the temperature of the heat transfer surface is constant at 50°C. The value of the fluid thermal resistance was held constant at 0.02°C/W. This corresponds to a volumetric air flow rate of 45 CFM (0.021 m3/s) or a water flow rate of 0.096 GPM (0.006 L/s). The convective thermal resistance was progressively decreased from a value of 0.04°C/W to provide fluid thermal resistance to convective thermal resistance ratios ranging from 0.05 to 3.0.
Figure 3. Effect of fluid to convective thermal resistance resistance ratio on the temperature of a cooling fluid passing over an isothermal heated surface.
Physically this is analogous to starting off with a heat sink with a given number of fins and a fixed coolant flow rate and then increasing the number of fins without attempting to increase the flow rate. As more and more fins are added the heat transfer coefficient and heat transfer area would increase, reducing the convective resistance while the thermal fluid resistance remains constant, thereby causing the ratio of the fluid to convective resistance to increase. Examining Figure 3 it can be seen that for ratios less than 0.5 the profiles are linear or very nearly linear. In this region the isoflux resistance model will give reasonable results even if the surface is isothermal. As the ratio increases beyond 0.5 the profiles become increasingly non-linear. The thermal resistance calculations based upon the isoflux model will begin to underpredict the total thermal resistance that would pertain to an isothermal surface and become progressively worse as the ratio increases.
This naturally poses the question as to how to correctly calculate the total thermal resistance if the surface is assumed to be isothermal. Fortunately, a relationship may be derived that relates the total thermal resistance for an isothermal surface to the two components of resistance (i.e., Rfluid and Rconv) introduced in the discussion of the isoflux model. This relationship is:
 |
where R* is the total thermal resistance from the isothermal surface to the fluid at the inlet.
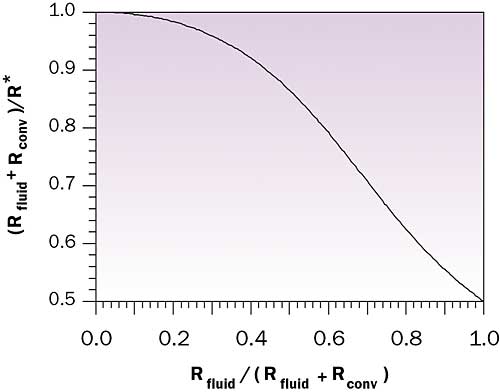
Figure 4. Ratio of isoflux thermal resistance to isothermal thermal resistance.
Figure 4 shows the ratio of the isoflux thermal resistance to the isothermal resistance as a function of the ratio of the fluid thermal resistance to the total thermal resistance from the isoflux model. As can be seen, if the contribution of fluid temperature rise is small compared to the overall isoflux thermal resistance, the isoflux thermal resistance and the isothermal thermal resistance calculated using equation (4) are nearly the same. If the contribution of fluid temperature rise becomes large compared to the overall isoflux thermal resistance then the isoflux model may seriously underpredict the total thermal resistance for an isothermal surface. In the limit as the ratio of the fluid thermal resistance to the total thermal resistance from the isoflux model approaches 1 (i.e., Rfluid >> Rconv), the isoflux model will underpredict the isothermal thermal resistance by 50%.
Fortunately, in most practical applications the fluid thermal resistance will be a much smaller fraction of the total thermal resistance and the isoflux model may be safely used. However, as increased heat fluxes make it necessary to provide air-cooled heat sink and water-cooled cold plate designs with lower and lower convective thermal resistance, it would be prudent to use either Figure 4 or equation (4) to insure that when performing a quick estimate total thermal resistance is not being underestimated.


