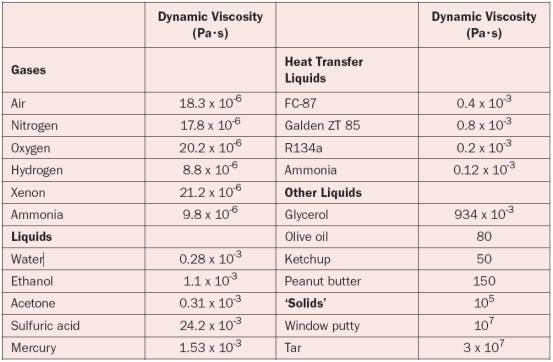
Table 1. Dynamic Viscosity Values for Various Gases and Liquids
When we look at a fluid parcel subject to a velocity gradient in the direction perpendicular to the direction of the flow, we observe that this fluid parcel deforms. This type of deformation is called shear. The ability to withstand shear is a material property called the dynamic viscosity m. The viscosity determines the amount of friction between two adjacent layers of fluid with different velocities. Stated otherwise, viscosity is a measure of the resistance of a fluid to deform under shear stress. A fluid that has no resistance to shear stress is known as an ideal fluid.
- The dynamic viscosity m is related to the kinematic viscosity
n (Greek symbol nu) through m = rn with r the density. - The SI unit of dynamic viscosity is the pascal-second (Pa·s), which is identical to 1 kg/m·s.
- The cgs unit for dynamic viscosity is the poise (P). 100 centipoise = 0.1 Pa·s.
- The kinematic viscosity has SI units (m2/s). The cgs unit for
kinematic viscosity is the stokes (St), where 100 centistokes =
1 cm2/s.
Note that the units for kinematic viscosity is the same as for thermal diffusivity, and indeed, viscosity may be considered as a measure of the diffusion of momentum. From a pure physics point of view, the viscosity of a system is determined by how molecules constituting the system interact. We should make a distinction between gases and fluids.
Gases
Viscosity in gases arises principally from the molecular diffusion that transports momentum. The kinetic theory allows accurate prediction of the viscosity of gases.
Liquids
In liquids, the additional forces between molecules become important, which makes an accurate prediction much more difficult and requires the use of molecular dynamics computer simulation. The dynamic viscosities of liquids are typically several orders of magnitude higher than the dynamic viscosities of gases. For both gases and liquids the viscosity is nearly independent of pressure under normal operating conditions. However, the temperature dependence can be quite large, and as a rule-of-thumb it may be stated that for gases the viscosity increases as temperature increases while for fluids the trend is opposite. Table 1 shows the dynamic viscosity for typical gases and fluids, at room temperature.
Note that the viscosities of several fluids that are of interest to liquid cooling are lower than that of water. Of course, other physical properties are equally important. The interested reader may consult the references at the end.
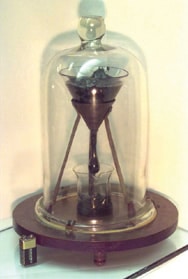
Figure 1. Pitch viscosity experiment, started in 1930.
(copyright University of Queensland)
To close this column, I would like to direct your attention to an interesting experiment concerning the measurement of the viscosity of tar that started in 1930 and still continues (see Figure 1). Tar pitch appears solid, and can be shattered with a hard impact, but it is actually fluid. It flows at room emperature, but extremely slowly. The pitch drop experiment taking place at University of Queensland in Brisbane, Australia, is a longterm experiment which measures the flow of a piece of pitch over many years. For the experiment, pitch was put in a glass container with a hole in the bottom, and allowed to slowly drip out. Since the pitch was allowed to start dripping in 1930, only eight drops, albeit large ones, have fallen. It was demonstrated in the 1980’s that the pitch in the experiment has a viscosity approximately 100 billion (1011) times that of water (from Wikipedia).
References
- 1. Mohapatra, S., “An Overview of Liquid Coolants for Electronics Cooling,” ElectronicsCooling, Vol. 12, No.2, May 2006.
- Simons, R., “Comparing Heat Transfer Rates of Liquid Coolants,” ElectronicsCooling, Vol. 12, No.2, May 2006.
- Ellsworth, M., “Comparing Liquid Coolants from Both a Thermal and Hydraulic Perspective,” ElectronicsCooling, Vol. 12, No.3, August 2006.


