Introduction
Thermal Interface Materials (TIMs) play a key role in the thermal management of electronic systems by providing a path of low thermal resistance between the heat generating devices and the heat spreader/sink. Typical TIM solutions include adhesives, greases, gels, phase change materials, pads, and solder alloys. Most TIMs consist of a polymer matrix, such as an epoxy or silicone resin, and thermally conductive fillers such as boron nitride, alumina, aluminum, zinc oxide, and silver. The reader is referred to Viswanath et al. [1] and Saums [2] for more information on the different TIM options used in industry and their capabilities.
Amongst the various TIM options, thermal greases typically offer better thermal performance and reduced manufacturing cycle times. They have the ability to flow and conform to interfaces, do not require post-dispense processing such as curing, and have higher effective thermal conductivity compared to other classes of materials. In addition, thermal contacts made using thermal greases can be reworked allowing easy repair and upgrade. For these reasons, thermal greases are extensively employed in microelectronics and power module cooling applications.
However, on extended operation and over time, greases can degrade significantly, resulting in a higher thermal resistances across the grease interface. The degradation mechanisms of greases are considerably different and more complicated to characterize than those of other common TIM solutions such as adhesives and pads. The power cycling test is most representative of the end use environment and hence an accurate technique to assess the thermal and reliability performance of thermal greases. However, power cycling tests can be very time consuming and expensive for screening numerous interface materials from an end-user’s perspective or from a material developer’s perspective. Accelerated reliability tests utilizing a combination of materials, simple structures, and test conditions that simulate different stress conditions experienced by an actual module can offer significant reductions in test time, while providing meaningful data.
Failure Mechanisms of Grease Interface Layers
Thermal greases do not contain any cure chemistry, hence they will not cross-link to form a gel or a hard adhesive type material. Their uncured state that provides the improved ability to provide a low interfacial thermal resistance also makes them susceptible to a variety of failure mechanisms during their service life, some unlike those experienced by thermal gels, adhesives, and pads.
The two main causes of increase in thermal resistance of a grease layer are grease pump-out and grease dry-out. The powering up or powering down of the device causes a relative motion between the die and the heat spreader (in-plane and out-of-plane), which tends to squeeze the thermal grease out of the interface gap. This phenomenon is referred to as “pump-out” and results in increased thermal resistance due to loss of grease material from the interface [1, 3].
Grease “dry-out” occurs due to the separation of the filler from the polymer matrix at elevated temperatures. The polymer matrix tends to flow out of the interface preferentially and results in ‘drying-out’ of the thermal grease. This results in increased in-situ thermal resistance of the material [1]. Exposure to high humidity levels has also been shown to induce changes in the thermal resistance of a grease layer, primarily an effect of the filler and resin system employed and their response to high levels of moisture.
Thermal Characterization of Greases
Several steady state and transient methods exist for measuring the thermal performance of greases. The thermal resistance data presented in this article was obtained using a laser flash thermal diffusivity method, which facilitated measurement using representative surfaces, different bondline thicknesses (BLTs), different pressures, and in a very short period of time due to the transient nature of the measurement.
The in-situ thermal resistance of the greases was measured using a three-layer ‘sandwich’ sample comprising of an aluminum-grease-silicon stack. The thermal resistance determined using this method includes the bulk thermal resistance of the grease and the contact resistances at the grease-substrate interfaces. The reader may refer to Campbell et al. [4] for more information on the advantages and limitations of the laser flash technique.
Table 1. Characteristics of Greases Studied and their Thermal Performance
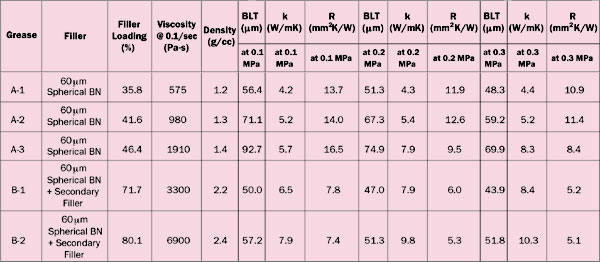 |
Table 1 shows the characteristics of five greases that were studied and their thermal performance as measured using the laser flash thermal diffusivity method. These thermal measurements were within 10% of those made within a microprocessor module. The primary filler in these greases is spherical boron nitride (BN) with an average filler size of 60 �m. Greases B1 and B2 have secondary fillers included in the base grease formulation of spherical BN fillers. First order effects and interaction effects are observed with respect to the performance of the greases. An increase in in-situ thermal conductivity is observed with an increase in filler loading for all five greases.
The increase in viscosity with increase in filler loading results in thicker BLTs for a given pressure level and hence a higher thermal conductivity composition does not always result in a lower in-situ thermal resistance interface. At very high filler loadings (these are not discussed in this article and the loading threshold varies with filler and resin system), there is a significant increase in interfacial thermal resistance as the greases do not wet the mating surfaces well. Table 1 also shows a significant reduction in thermal resistance with increasing pressure due to a combination of reduced bondline thickness and interfacial thermal resistance. More information on these greases, their properties, and their performance can be found in Gowda et al. [5].
Reliability Testing
Four types of reliability tests were performed � air-to-air thermal cycling, high temperature storage, high temperature/humidity exposure, and mechanically induced pump-out. Table 2 provides details of the reliability tests.
Table 2. Reliability Tests Performed
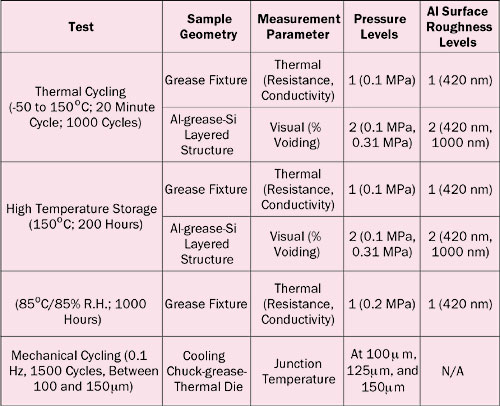 |
High temperature storage can be used to accelerate the drying-out of the thermal grease layers. Weight loss at elevated temperatures is also used as an indicator of grease dry-out [6] . Thermal cycling tests help induce grease movement, in a manner similar to power cycling, however between two isothermal temperature zones. The high temperature and humidity test induces moisture driven degradation of the grease interface layer.
For the thermal cycling and high temperature storage tests, two sample geometries were used. One, a three-layered silicon-grease-aluminum sample in a grease fixture wherein different bolt pressures can be applied was utilized to measure the thermal performance of the greases at time-zero and after reliability testing. Second, three-layer structures of aluminum -grease-silicon were utilized to monitor the degradation of the grease layers using acoustic microscopy. Different bolt pressures and surface roughness of the aluminum plates were used in the visual tests to determine if there was any effect of these parameters on the degradation of a grease interface.
The Al-grease-Si structures simulate grease movement due to the relative in-plane movement of the aluminum, silicon, and grease layers during temperature changes. However, in tests using these structures there is no cyclic change in the TIM bondline with temperature cycling, which is essential to fully simulate the warpage and pump-out mechanism that is typically seen in a flip chip module. In certain applications, though, warpage induced pump-out can be a secondary effect as compared to those driven by high temperature, high humidity, and in-plane grease movement.
To simulate the pump-out effect of grease layers due to the dimensional changes in the package, an accelerated mechanical cycling test was adopted. This mechanically induced pump -out test was reported by Chiu et al. [3], where the TIM gap is cyclically varied between two gap limits that are representative of the dimensional changes in the module under study. This test can simulate power cycling effects, but with a much faster turn-around times, and has been validated by Chiu et al. [3].
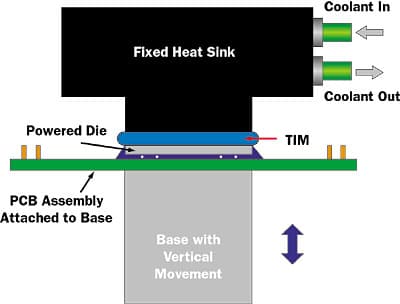 |
Figure 1. Mechanical cycling setup to simulate grease pump-out.
Figure 1 shows the schematic of the test set-up on an Instron® Universal Testing Machine. As shown in the figure, the test vehicle was comprised of a thermal test die (6.35 x 6.35 x 0.6 mm ) mounted on a printed circuit board. The thermal die assembly was fixed to the actuator base of the testing machine and a liquid-cooled chuck (with coolant at 30�C) was connected to the fixed head. The bondline thickness of the grease was cyclically varied between 100 and 150 �m, with junction temperature being measured every 500 cycles. For reference, Maguire et al. [7] also presents an alternative method to simulate power cycling and grease pump-out.
Reliability Test Results
Figure 2 shows the results of the reliability tests on the five greases. The percentage change in thermal resistances and bondline thicknesses for the different greases under different test conditions are shown. Data for the temperature/humidity test was available only for greases B -1 and B-2. In the Al-grease-Si sandwich structures based reliability tests (high temperature storage, thermal cycling, and temperature humidity exposure), all the greases were observed to reduce in thermal resistance. This decrease in thermal resistance was accompanied by a reduction in bondline thickness.
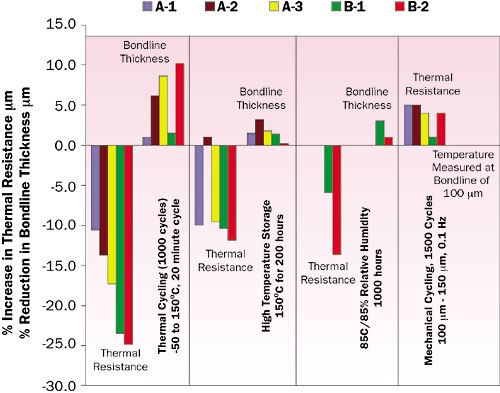 |
Figure 2. Results of the grease reliability tests.
Exposure to higher temperatures during these tests caused the greases to reduce in viscosity and under the applied clamping force, reduce in bondline thickness and wet the mating surfaces better to reduce both bulk and interfacial resistances. The reduction in viscosity at elevated temperatures had a more beneficial impact for the higher viscosity greases (A-3, B-1, and B-2).
The accelerated mechanical cycling pump-out test was more severe than the fixture based thermal cycling test and resulted in an increase in junction temperature of the device. In the Al -grease-Si fixture-based thermal cycle tests, the thermal resistance dropped for all greases.
It is important to note that in the case of the fixture-based test, the pressure on the grease layers was applied consistently across the five greases, allowing the viscosity and filler characteristics to dictate the resulting bondline thickness, while in the case of the mechanical cycling test, similar bondlines were maintained for all the greases.
In addition, the Al-grease-Si structures allow a reduction in BLT when the viscosities of the greases reduce at elevated temperatures but do not impose a cyclic change in TIM bondline during temperature cycling. In the mechanical cycling test, the BLT is maintained between the same two set limits but varied cyclically between these limits. This explains the difference in the results between the thermal cycling and mechanical cycling tests.
Figure 3 shows a result from the visual degradation studies and acoustic microscopy images of samples before and after stress testing. Greases with only spherical BN fillers (A-1, A2, and A-3) showed an increase in voiding with increasing filler content, but no significant effect of the pressure on the grease interface or the roughness of the mating surfaces. Greases with spherical BN particles and a secondary filler (B-1 and B-2) displayed a slight reduction in voiding with increasing filler content and an effect of the pressure and surface roughness. This stresses the fact that results can vary significantly based on the grease characteristics, process parameters, and the mating surfaces.
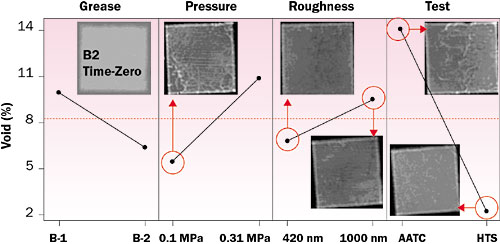 |
Figure 3. Visual degradation of grease interfaces for different stress test conditions.
Although there was an increase in voiding in all cases, the same structures and materials did not show an increase in thermal resistance in similar stress tests. This points to the fact that the reduction in overall thermal resistance caused by a decrease in BLT and interfacial thermal resistance can, at times, be greater than or similar to the increase in thermal resistance caused by voiding, thereby offsetting each other to some extent.
Conclusions
Characterizing the reliability of thermal greases is complicated and requires different test methods as compared to other TIM options. Although the three-layered structures used to monitor the thermal performance with reliability testing and those used to monitor visual degradation do not simulate the full range of stress conditions that is seen in a microprocessor package, they provide a means to screen thermal greases for dry-out, voiding, and in-plane grease movement during the initial stages of a grease selection process or grease development process.
These tests typically overestimate the reliability of a thermal grease layer, primarily since they do not simulate the pump-out mechanism accurately. The mechanical cycling test discussed in this article can be used complementarily to include some of the power cycling pump-out effects.
Grease characteristics (e.g. filler material, rheology, resin system, etc.), process parameters (e.g. grease application method, clamping force and method, etc.), end-use environmental conditions, and geometries (e.g. cooling structure, dimensions of die and spreader/sink, surface roughness, etc.), all have an effect on the thermal performance of a grease layer and its reliability. Hence, there may not be one grease that is the best option for all geometries, processing conditions, and use conditions.
The most accurate results will therefore be obtained when all the candidate greases are applied in the actual package and operated under actual use conditions. However, testing a large number of candidate greases in this manner is not practical and a more efficient method is needed to narrow down to a few promising candidates. A combination of accelerated stress tests using thermomechanically similar and geometrically representative test structures that are discussed in this article is a means to shorten the list of the right materials for an application and a step towards predicting their long term performance.
Acknowledgments
This work was performed under the support of the U.S. Department of Commerce, National Institute of Standards and Technology, and Advanced Technology Program, Cooperative Agreement Number 70NANB2H3034. The authors acknowledge the support of GE Silicones (now Momentive Performance Materials Inc.). The authors also acknowledge the contributions of Don Buckley and Sara Paisner.
References
- Viswanath, R., Wakharkar, V., Watwe, A., and Lebonheur, V., “Thermal Performance Challenges from Silicon to Systems,” Intel Technology Journal, Q3, 2000.
- Saums, D, “Developments with Metallic Thermal Interface Materials,” ElectronicsCooling, Vol. 13, No. 2, 2007.
- Chiu, P-C., Chandran, B., Mello, M., and Kelly, K., “An Accelerated Reliability Test Method to Predict Thermal Grease Pump-Out in Flip-Chip Applications,” Electronic Components and Technology Conference, 2001.
- Campbell, R. and Smith, S., “Flash Diffusivity Method: A Survey of Capabilities,” ElectronicsCooling, Vol. 8, No. 2, 2002.
- Gowda, A., Paisner, S., Acharya, A., Meneghetti, P., Hans, P., Nagarkar, K., Tonapi, S., Strosaker, G., and Srihari, K., “Spherical Boron Nitride Fillers For High Performance Thermal Greases,” 7th Electronics Packaging and Technology Conference (EPTC 2005), Singapore, 2005.
- Hunadi, R. and Wells, R., “Thermal Greases with Exceptionally High Thermal Conductivity and Low Thermal Resistance,” International Symposium on Advanced Packaging Materials, 1998, pp. 198-202.
- Maguire, L., Behnia, M., and Morrison, G., “Systematic Evaluation of Thermal Interface Materials � A Case Study in High Power Amplifier Design,” Microelectronics and Reliability, vol. 45, 2005, pp. 711-725.


