Over the past several years thermal engineers and others in the computer industry have become acutely aware of the challenge of increasing power dissipation and the potential of liquid (principally water) cooling to provide a thermal management solution. A number of articles in ElectronicsCooling have addressed both the issue of increased power dissipation [1-4] and various aspects of liquid cooling [5-16]. This Calculation Corner article will address another aspect related to liquid cooling, which is the dew point temperature. The dew point temperature sets the practical lower bound for the temperature of the coolant to be used to cool the electronics. If this limit is ignored and a lower coolant temperature is employed this can in some cases lead to real problems due to moisture condensation.
Just about all readers will be familiar with both the term dew point temperature (Tdp) and relative humidity (RH) from daily television weather forecasts and some may even remember these terms from a college course in thermodynamics. Air normally contains a certain amount of water vapor. The maximum amount of water vapor that air can hold depends upon the temperature of the air, sometimes referred to as dry bulb temperature (Tdb). The higher the air temperature, the more moisture or water vapor it can hold. When the air contains as much moisture as possible, the air is saturated or at the dew point. At saturation the air temperature and dew point are the same. The ratio of water vapor in the air to the maximum it can hold (i.e., saturation) is termed the relative humidity. As the air temperature approaches the dew point temperature for a given absolute humidity, it will become saturated and moisture will condense out of the air. If a surface is cooled below the dew point, the air in contact with the surface will become saturated and dew will form on the surface.
 |
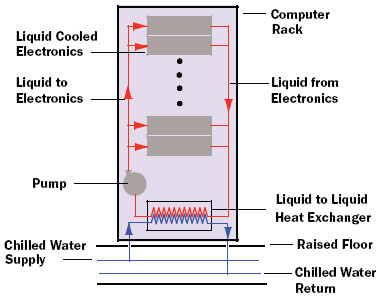
Figure 1. Example of liquid cooled computer electronics rack which rejects heat to facility water.
In hybrid water-to-air systems this does not pose a problem [5]. In such systems the cooling water temperature cannot be below the cooling air temperature, so the surface temperature of pipes and cold plates cannot possibly reach the dew point temperature. In systems that use facility water as the heat sink (see Figure 1), water temperatures below the room air temperature may be employed to maximize the system cooling capability. In such instances the thermal engineer must insure that liquid carrying components in contact with the electronics do not reach the dew point temperature.
The thermal engineer must be aware of the environment specification in terms of air temperature and relative humidity for the facility in which the equipment will be installed. ASHRAE, for example, has established allowable classes of operating conditions in terms of room air temperature (dry bulb) and relative humidity. These are presented in the form of operating envelopes on psychometric charts in and cover a range of air temperatures from 5 to 40�C and relative humidity from just below 10 to 80% [17]. To determine the highest dew point temperature to be expected the thermal engineer must know the highest room air temperature and highest relative humidity for the environment in which the equipment will be installed.
Given the highest room air temperature and highest relative humidity the engineer may determine the highest possible dew point temperature. One way this may be done is to use a psychometric chart. Readers who would like to learn more about the psychometric chart and how to use it to find the dew point may refer to a thermodynamics textbook or the internet [18].
The remainder of this article will describe the development of an equation giving dew point temperature in terms of relative humidity and air temperature based upon the Magnus-Tetens equation for the partial pressure of water vapor in air [19]. This equation is
 |
where a = 17.27 , b = 237.7, T is in �C and pw is in kiloPascals. The vapor pressure, pw, is related to the relative humidity, RH, and vapor saturation pressure, pws, by
When the air is saturated, the relative humidity is 100% and the temperature of the air-water vapor mixture, which is the dry bulb temperature Tdb, is equal to the dew point temperature, Tdp. So, substituting equation (1) into equation (2) gives
 |
Canceling out the constant, 0.6105, from both sides of equation (3) and taking the natural logarithm of both sides results in
 |
Then, rearranging equation (4) to solve for Tdp gives
 |
 |
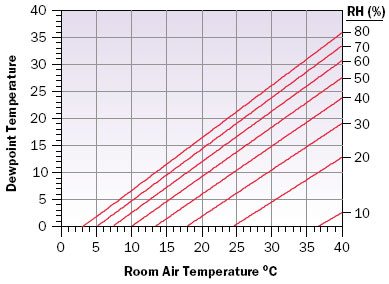
Figure 2. Dewpoint temperature vs. room air temperature for lines of constant relative humidity.
|
It should be noted that percent RH should be entered as a decimal equivalent (e.g., 35% RH is entered as 0.35) in the preceding equations. Results for dew point temperature obtained using equation (5) are shown in Figure 2 and Table 1. Alternatively the reader may find a number of dew point calculators on the internet. A website that the author found particularly interesting is one maintained by the National Weather Service in Salt Lake City [20]. This site offers a dew point calculator, as well as a number of other interesting weather related calculators. If any readers choose to try the dew point calculator, they will find that station pressure also needs to be entered. This is because this particular calculator also gives wet bulb temperature, which is sensitive to pressure. For the purpose of calculating dew point temperature any dummy value may be entered, since the dew point temperature is not sensitive to atmospheric pressure. It is suggested that a value of 760 millimeters of mercury (which corresponds to standard atmospheric pressure at sea level) be entered. The author used this calculator to compare with the results obtained with equation (5) and found that the difference was 0.1�C or less.
Finally, it is suggested that in setting the minimum liquid coolant temperature within an electronics rack, a value 2 or 3�C higher than the calculated maximum dew point temperature be used to provide a sufficient design margin to guard against possible water vapor condensation on the cool surfaces.
References
- Azar, K., “The History of Power Dissipation,” ElectronicsCooling, Vol. 6, No. 1, pp. 42-50, Jan. 2000.
- Azar, K., and Morabito, J., “Managing Power Requirement in the Electronics Industry,” ElectronicsCooling, Vol. 6, No. 4, pp. 12-25, Dec. 2000.
- Schmidt, R., “ASHRAE Committee Formed to Establish Thermal Guidelines for Datacom Facilities,” ElectronicsCooling, Vol. 11, No. 1, pp. 28-34, Feb. 2005.
- Belady, C., “In the Data Center, Power and Cooling Costs More Than The IT Equipment it Supports ,” ElectronicsCooling, Vol. 13, No. 1, pp. 24-27, Feb. 2007.
- Simons, R., “Estimating Temperatures in a Water-to-Air Cooling System,” ElectronicsCooling, Vol. 8, No. 2, pp. 8-9, May 2002.
- Copeland, D., “Review of Low Profile Cold Plate Technology for High Density Servers,” ElectronicsCooling, Vol. 11, No. 2, pp. 14-18, May 2005.
- Ellsworth, M. and Simons, R., “High Powered Chip Cooling � Air and Beyond,” ElectronicsCooling, Vol. 11, No. 3, pp. 14-22, Aug. 2005.
- Schmidt, R., “Liquid Cooling is Back,” ElectronicsCooling, Vol. 11, No. 3, pp. 34-38, Aug. 2005.
- Lasance, C. and Simons, R., “Advances in High-Performance Cooling for Electronics,” ElectronicsCooling, Vol. 11, No. 4, pp. 22-39, Nov. 2005.
- Mohapatra, S., “An Overview of Liquid Coolants for Electronic Cooling,” ElectronicsCooling, Vol. 12, No. 2, pp. 22-27, May 2006.
- Simons, R., “Comparing Heat Transfer Rates of Liquid Coolants Using the Mouromtseff Number,” ElectronicsCooling, Vol. 12, No. 2, pp.10-14, May 2006.
- Ellsworth, M., “Comparing Liquid Coolants From Both a Thermal and Hydraulic Perspective,” ElectronicsCooling, Vol. 12 , No. 3, pp. 36-38, Aug. 2006.
- LaPlante, S., Aubry, N., Rosa, L., Levesque, P., Aboumrad, B., Porter, D., Cavanaugh, C., and Johnston, J., “Liquid Cooling of a High-Density Computer Cluster,” ElectronicsCooling, Vol. 12, No. 4, pp. 12-19, Nov. 2006.
- Simons, R., “Using a Simple Air Recirculation Model to Explore Computer Rack Cooling,” ElectronicsCooling, Vol. 13, No. 1, pp. 8-11, Feb. 2007.
- Simons, R., “Estimating the Effect of Intercoolers for Computer Rack Cooling,” ElectronicsCooling, Vol. 13, No. 2, pp. 8-11, May 2007.
- Colgan, E., Bezama, R., Gaynes, M., and Marston, K., “A Practical Implementation of Silicon Microchannel Coolers,” ElectronicsCooling, Vol. 13, No. 4, pp. 18 – 23, Nov. 2007.
- ASHRAE, “Datacom Equipment Power Trends and Cooling Applications,” 2005, available from http://tc99.ashraecs.org/
- Bucklin, R. and Haman, D., “Reading the Simplified Psychometric Chart for Frost Protection,” http://edis.ifas.ufl.edu/AE406
- Bahrenbrug, A., Psychrometry and Psychrometric Charts, 3rd Edition, Cape and Transvaal Printers Ltd., Cape Town, South Africa, 1974.
- http://www.wrh.noaa.gov/slc/projects/wxcalc/wxcalc.php


