Part II can be found here.
There is an increasing need for calculating integrated circuit temperatures during conditions of changing chip power. Varying computer workloads and the implementation of power-saving strategies are leading to greater variability in chip power levels than in the past. As reliability requirements get more stringent there are growing concerns about the effect of temperature changes on die and package integrity. The latest JEDEC standard for measuring the junction-to-case thermal resistance uses a transient method [1].
This article seeks to provide greater insight into transient thermal phenomena in high-power IC packages and examines a number of approaches for predicting transient thermal behavior.
OVERVIEW
This work extends the effort described in two recent installments of this column devoted to the steady-state thermal analysis of high-power IC packages attached to heat sinks [2, 3].
The present effort is also divided into two parts. Part 1 focuses on nuances of transient heat transfer and explores three different methodologies using a simplified model of the package and heat sink.
Part 2 will extend this analysis to more practical examples such as those treated in the recent columns as well as the JEDEC junction-to-case thermal resistance test. It will be published in the Spring 2012 issue.
This article explores three analysis methods: 1) finite element analysis (FEA), 2) an analytical, multi-stage RC model, and 3) a numerical, multi-stage RC model (RC = Resistor Capacitor). A commercial code was used to implement the FEA work [4]. Methods 2 and 3 were implemented in spreadsheets.
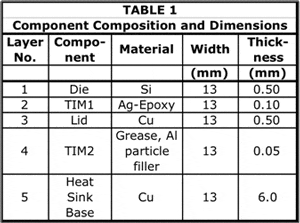
The current analysis assumes the same package construction as in the recent columns, namely a high-power IC package attached to a heat sink, as depicted in Figure 1. In this model, two simplifying assumptions were made: 1) heat flow to the package substrate and to the PCB is neglected and 2) the cooling effect of heat sink fins is represented by the application of a suitable heat transfer coefficient directly to the heat sink base. Hence, the only components explicitly represented in the model are the die, TIM1, lid, TIM2, and the heat sink base (where TIM = Thermal Interface Material).
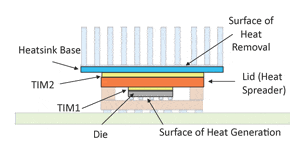
A further simplifying assumption for Part 1 only of this article is that the width of all components is equal to that of the die, making the heat flow one-dimensional. This will simplify the task of evaluating the relative accuracy of the analytical and numerical multi-stage RC models.
Finite Element Analysis Solution
Assumptions
Figure 2a depicts the solid model representing the five aforementioned components. It is a one-quarter model, because of the symmetry in the component geometry, heat load, and boundary condition. In the subsequent text, comments regarding up and down directions (or top and bottom) in the component stack-up are made with reference to this figure.

Results
The results of the FEA solution are shown in Figures 2 and 3. Figure 2a shows the thermal contour maps for elapsed times in the range 2E-7 to 100 seconds. As expected, the heat flow is one-dimensional. Interpretation of the contour plots is assisted by Figure 2b, which attempts to capture the spatial and temporal variations of temperature in the model. It plots the temperature for each node at a given z-axis location for each FEA solution illustrated in Figure 2a. (The z-axis is assumed to have an “up” orientation).
Clearly, the temperature rise at all levels in the model proceeds most rapidly in the early portions of the time interval explored. The steady state is nearly achieved after only 8.5 seconds. There is only a slight further increase in temperature after 100 seconds have elapsed.
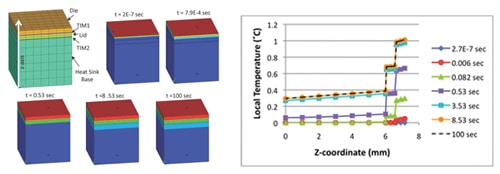
Most of the temperature rise occurs within the TIM layers and at the heat sink-to-air interface. In contrast, the temperature variation within the die, lid, and heat sink base is relatively small. Hence the thermal behavior of the package/heat sink stack can be efficiently captured by tracking the temperature of nodes at the top of the die, lid, and heat sink base.
Figure 3a is a linear plot of the temperatures at these three locations versus time. It displays the behavior normally expected in a transient thermal situation, with the rapid initial temperature rise as discussed in the context of Figure 2b. Unfortunately, since most of the graph represents time intervals during which the system is near or at the steady state, it is not the best vehicle for documenting the nuances of a transient thermal model.
In contrast, the log-log plot in Figure 3b expands the scale considerably in the very short time scales, down to 1E-7. It clearly shows that, up to approximately 5E-4 seconds, the only heat flow occurs within the die. Heat flow doesn’t reach the heat sink base until about 2E-3 seconds. Because of their advantages, log-log plots are used in the subsequent analyses.

Lumped-Parameter Thermal Circuit Models
A further examination of Figure 2a indicates that there are alternating regions of different transient behavior: 1) small thickness and large temperature rise (TIMs and heat-sink-to- air thermal resistance) and 2) larger thickness and small temperature rise across them (die, lid, and heat sink base). The first class of regions has a dominant resistive behavior while the second exhibits capacitive behavior.
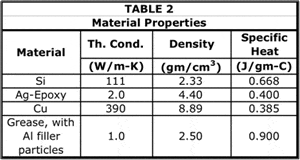
The one-dimensional heat flow situation allows us to easily calculate the thermal resistance, R, and heat capacity, C, of each layer using the following formulas:
C = Specific Heat * Density * Volume (3)
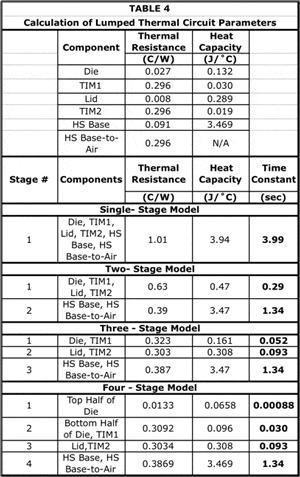
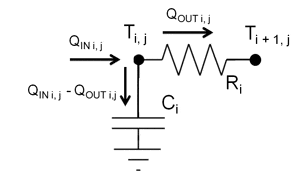
Table 4 lists the calculated values of RCONDUCTIVE and C for each component and for the heat sink base-to-air thermal resistance, RCONVECTIVE, are listed in Table 4. The stated values confirm the dominant behavior of each region as described above. This suggests the possibility that a multi-stage RC circuit model could be used to represent the thermal behavior of the package/heat sink stack. Figure 4 represents a template for an RC ladder circuit that could be scaled to an arbitrary number of RC stages.

As indicated in the lower part of Table 4, it is possible to lump the various layers in the package stack-up into RC ladder models consisting of various numbers of stages. The thermal resistance and heat capacity of each stage would each equal the sum of these parameters for each of the components lumped into that stage. The thermal time constant for each stage equals the product of its total R and C values. It should be noted that up to 3 stages, the lumped elements are delineated by component interfaces. To create 4 stages, the die is divided into upper and lower parts. In the subsequent sections, these lumped parameter values are used for both analytical and numerical transient calculations. It should be noted that, as the number of stages is increased, the time constant for the first stage (containing the die) gets smaller and smaller and, hence, should enable the model to better track the short-time-scale transient behavior of the die.
Analytical Multi-Stage RC Model
Equation 4 provides a convenient method of calculating the transient behavior of the junction temperature, TJ, in response to stepwise increase in power from zero to a constant value, beginning at time = 0.
(4)
where ΘJA, the junction-to-air thermal resistance, is equal to the sum of all the Ri values and τi is the thermal time constant of the ith stage, equal to Ri*Ci.
Note that this equation is not an exact solution for this type of problem. However, it often provides adequate accuracy in situations such as the present one involving a multi-layer structure, with each layer having a significantly different time constant from the others [5]. The reader is directed to Ref. [6] for a more rigorous derivation of multi-stage thermal networks.
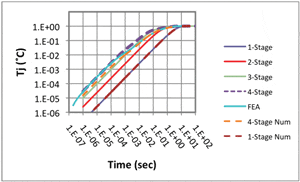
Figure 5 compares predictions of the analytical model with those of the FEA model (and the numerical model, to be discussed below). Obviously, increasing number of stages in the analytical model improves accuracy. The calculation using the 4-stage analytical model is in good agreement with the FEA prediction. The maximum discrepancy between them is 0.2˚C, occurring at time = 0.1 second.
Numerical Multi-Stage RC Model
The preceding analysis has demonstrated acceptable accuracy using the analytical model. It has the virtue of being very easy to implement for a simple power on/power off situation. The main problem, however, is that it becomes much more complicated to use it to calculate the effect of an arbitrary change in power on the junction temperature. The normal approach to dealing with this situation is to perform a Laplace transform transfer function analysis, which can be quite challenging [6].
Numerical methods, such as the one described below, are more difficult to implement initially. However, they can readily be adapted to account for the effect of an arbitrary power waveform on the junction temperature.
Methodology
Assume a series RC circuit containing the desired number of stages. The heat flow from the junction to the ambient at a given value of instantaneous power can be calculated by discretizing time into sufficiently small steps, and applying the following procedure [7].
• At time < 0, zero power is applied to the die. The temperature of all nodes is equal to that of the ambient.
• For time ≥ 0, in a given time step, δt, a quantity of thermal energy is injected into the left side of the ladder network by the die, as indicated in Figure 4.
• This quantity of energy, Q, is equal to δt*P, where P is the instantaneous dissipated power.
• The heat then propagates toward the right end of the network by flowing through each stage in the network ladder.
• The quantity of heat flowing from nodes iand i+1 during time step j is calculated with reference to Figure 6 using the following expression. It is directly proportional to the difference in the nodal temperatures andinversely proportional to the resistance, Ri.
(5)
• The change in temperature at a given node i, during time step j, is calculated using the net heat remaining in the node and the heat capacity of that node according to the expression:
• Finally, the temperature at node i can be calculated at the next time step, j + 1 from:
Ti,j+1 = Ti,j + ∆Ti,j (7)
Once the updated temperatures are calculated for all nodes, then the process repeats by sequentially applying equations 5, 6, and 7 to all nodes. It is repeated until the process steps though the time interval of interest.
Spreadsheet Structure
The spreadsheet structure to perform this calculation as described above is shown in Table 5a. Note that the calculation requires a fixed time step to converge. As we have seen, a transient solution can span several decades of time. This spreadsheet uses a technique to deal with this efficiently. There are three different sheets implementing the calculation with different time steps: Sheet 1, 1E-6 sec.; Sheet 2, 1E-4 sec.; and Sheet 3, 1E-2 sec. The calculation on each sheet begins at 0 time and proceeds at different rates per the chosen time step. Hence, Sheet 1 provides a much finer time resolution, suitable for the early portion of the transient. Each successive sheet lends itself to calculating the temperatures with a larger time step and, therefore, covering a larger span of elapsed time. The calculated results from all the calculation sheets, at the desired time steps, can be readily aggregated on the “Summary” sheet (described below) for graphing and further analysis.
Note that the power in a given time step is entered directly into the appropriate cell in Column C. As such, it can be varied at any desired time step(s).
A spreadsheet for RC circuits with more than one stage can be generated by the following recursive process:
• To create a 2-stage model, copy the cell contents from the range: [Col E, row 2: Col G, last row] and pasting it into the range: [Col G, row 2: Col I, last row]. Re-label cells G2 and F2 as “R2” and “C2”, respectively. Input correct values of these parameters into cells G3 and F3.
• To create a 3-stage model from the 2-stage model, copy the cell contents from the range: [Col G, row 2: Col I, last row] and paste it into the range: [Col I, row 2: Col K, last row], etc.
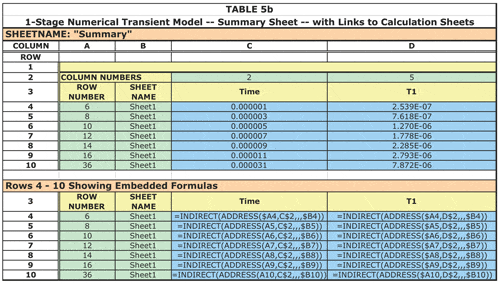
This spreadsheet has a fourth sheet described as the “Summary” sheet. Its structure is described in Table 5b. It uses the nested formulas “INDIRECT(ADDRESS(row,col,,,sheet))” to access an arbitrary solution temperature on any of the calculation sheets, per the row and sheet inputs to the ADDRESS function, in columns A and B. The present example only shows links to values on Sheet 1. However, as used by this author, these formulas are copied to many different rows to selectively access calculated values from all of the sheets.
The reader might be interested in reading a description of a much more sophisticated approach dealing with the issue of nested time scales (and spatial ones as well) with the objective of achieving computational efficiency in the spirit of the highly simplified example described here [8].
Results
Figure 5 compares the numerical results for the 1-stage and 4-stage models with both the FEA and analytical results. The 1-stage results for the numerical and analytical methods are nearly identical. The difference between them depends on the value of the time step. It was largest for the largest time step, equal to 1E-2. In this case it is 5E-4˚C. Since the 1-stage analytical result represents an exact solution, this precise correlation with the 1-stage numerical method is a confirmation of its accuracy.

Figures 7a and 7b compare the 3- and 4-stage numerical results with the FEA solution. Clearly, the 4-stage method provides a calculation of the junction temperature that is in better agreement with the FEA result than either the 3-stage numerical or the 4-stage analytical result. The lid temperature calculations for the numerical method are in good agreement with the FEA results. The calculated heat sink base temperatures are in slightly worse agreement. It is likely that the agreement could be improved by subdividing the heat sink base into an upper and lower half, as was done with the die.

Numerical 4-Stage RC Model with Variable Power
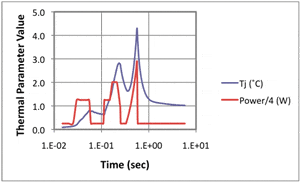
The 4-stage model, whose results with constant power are presented in Figure 7b, was modified simply by manually changing the power level at selected time steps in Col C of Sheet 3. In some cases a linear function relating power and time was input. The choices for instantaneous power were quite arbitrary and are intended mainly to exercise the numerical model.
The results, extracted by the Summary sheet from Sheet 3 only, are presented in Figure 8. As expected, the process for modifying the spreadsheet to accommodate the variable power input took only a few minutes.
Conclusions
With a sufficient number of RC stages, both a simple analytical model and a straightforward numerical give adequate accuracy when accounting for a simple power on/power off situation with a typical high-power IC package. However, if there is a need to account for the effect of a time-varying power level, the use of the numerical model provides the more convenient path to a solution.
In Part 2, the numerical methods applied here to one-dimensional heat flow situations will be extended to more typical situations involving diverging heat flows, using the methods recently developed in this column for steady-state thermal analyses of high-power packages.
Part 2 can be found here.
References
1. JEDEC Standard, JESD-14, “Transient Dual Interface Test Method for the Measurement of the Thermal Resistance Junction to Case of Semiconductor Devices with Heat Flow Through a Single Path.” Available for free download at www.jedec.com.
2. B. Guenin, “Thermal interactions Between High-Power Packages and Heat Sinks, Part 1,” ElectronicsCooling, Vol. 16, No. 4, Winter, 2010.
3. B. Guenin, “Thermal interactions Between High-Power Packages and Heat Sinks, Part 2,” ElectronicsCooling, Vol. 17, No. 1, Spring, 2011.
4. ANSYS®, Version 13.0
5. B. Guenin, “Simplified Transient Model for IC Packages,” ElectronicsCooling, Vol. 8., No. 3, August, 2002.
6. Y-L Xu, R. Stout, and D. Billings, “Electronic Package Thermal Response Prediction to Power Surge,” Proceedings, I-Therm Conference, May, 2000, 366-371.
7. B. Guenin, “Transient Thermal Model for the MQUAD Microelectronic Package,” Proceedings SEMI-THERM X Conference, February, 1994, pp. 86-95.
[8] J. S. Wilson and P. E. Raad, “A Transient Self-Adaptive Technique for Modeling Thermal Problems with Large Variations in Physical Scales,” International Journal of Heat and Mass Transfer, Vol. 47, pp. 3707-3720, 2004.

