By far and away the most common enquiry by someone using FloTHERM, especially at the start of their adoption, is “How do I model my components?”. This is hardly surprising as the mainstay of electronics thermal management is the control of operating component temperatures (junction and/or case). A virtual prototyping design by simulation approach requires models of components capable of such predictions. Who should be responsible for providing such models, the simulation tool vendor or the component vendor? A FloTHERM user isn’t concerned with such subtle distinctions, they simply want a model of their critical actives and they want it yesterday.
There are a few options when it comes to modelling components, most of which I covered in this blog series. Some more accurate than others, others less desirable for a vendor to supply than some.
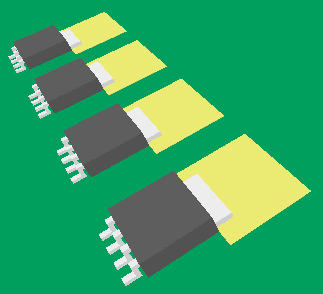
And speaking of component vendors… NXP Semiconductors, formerly Philips Semiconductors, started back in 2006. Today they focus on ‘no-big-chip-in-the-middle’ products, a delightfully honest phrase to describe a high performance mixed signal strategy. The pioneering use of FloTHERM at both NXP and Philips goes back many years. Today NXP provide detailed FloTHERM models of their power MOSFETs packaged in TO220, DPAK, D2PAK, LFPAK and various other styles. (see http://www.nxp.com/models/thermal.html).
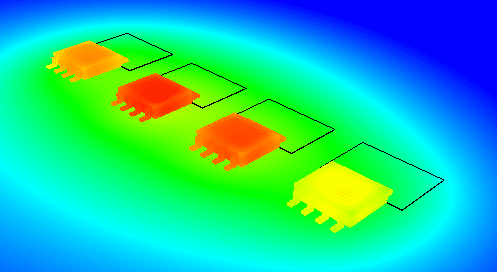
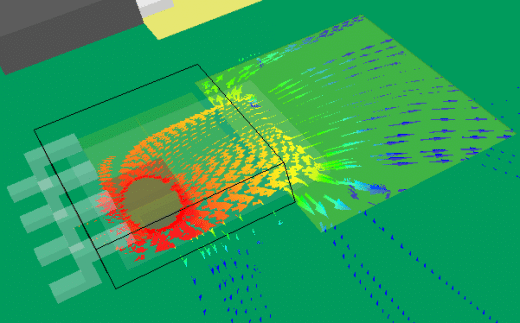
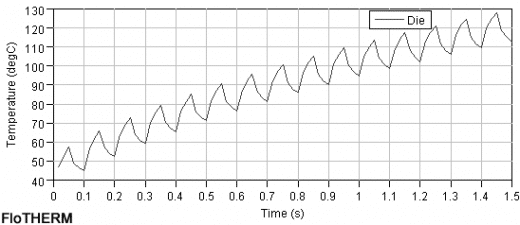
The 3D thermal package models are downloaded and placed into an existing FloTHERM model, i.e. the application environment the packages are to be deployed in. Their operating power dissipation is defined, a thermal prediction made by FloTHERM and the following typical outputs produced…
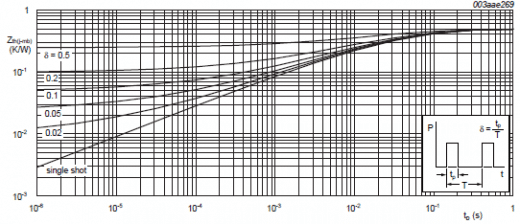
Inherent in the application of such power electronics parts is the transient nature of their operation, transient from a thermal perspective where the power cycles are such that the resulting temperatures are forever changing. So called Zth curves provide a measure of the thermal resistance response of a package to either a single or a series of power pulses, from on times in the order of 1e-6 seconds and upwards.
Knowing the periodic power profile one can make initial estimates as to the thermal response of the package using the Zth curve. More detailed 3D predictions can then be made in FloTHERM (using the available detailed models) where, for example, assumptions about the thermal environment of the package do not have to be guessed.

The FloTHERM model downloads from the NXP web site run at over 1000 per month. The availability of these, in conjunction with various compact electrical models, thermal design guides etc. typifies the value added approach that tier 1 vendors such as NXP take. An approach that is certainly appreciated by those engineers using and simulating NXP products. As a simulation software vendor we definitely applaud any effort to make the life of our own software userbase easier. The point being that together we allow our customers to make their design mistakes in software first, minimising the risk of their 1st physical prototype failing, getting their products to market more cost effectively and to the ultimate satisfaction of the end user!
4th January 2012, Ross-on-Wye

